

14 Assessment of Some Diurnal Streamwater Profiles in Western …
473
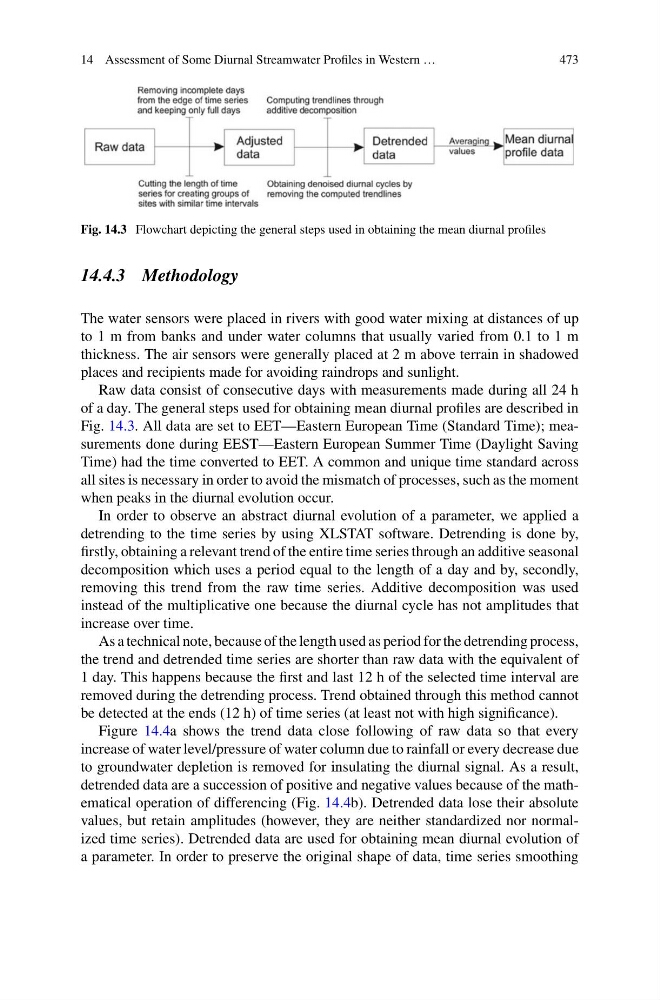
Fig. 14.3 Flowchart depicting the general steps used in obtaining the mean diurnal profiles
14.4.3 Methodology
The water sensors were placed in rivers with good water mixing at distances of up
to 1 m from banks and under water columns that usually varied from 0.1 to 1 m
thickness. The air sensors were generally placed at 2 m above terrain in shadowed
places and recipients made for avoiding raindrops and sunlight.
Raw data consist of consecutive days with measurements made during all 24 h
of a day. The general steps used for obtaining mean diurnal profiles are described in
Fig. 14.3. All data are set to EET—Eastern European Time (Standard Time); measurements done during EEST—Eastern European Summer Time (Daylight Saving
Time) had the time converted to EET. A common and unique time standard across
all sites is necessary in order to avoid the mismatch of processes, such as the moment
when peaks in the diurnal evolution occur.
In order to observe an abstract diurnal evolution of a parameter, we applied a
detrending to the time series by using XLSTAT software. Detrending is done by,
firstly, obtaining a relevant trend of the entire time series through an additive seasonal
decomposition which uses a period equal to the length of a day and by, secondly,
removing this trend from the raw time series. Additive decomposition was used
instead of the multiplicative one because the diurnal cycle has not amplitudes that
increase over time.
As a technical note, because of the length used as period for the detrending process,
the trend and detrended time series are shorter than raw data with the equivalent of
1 day. This happens because the first and last 12 h of the selected time interval are
removed during the detrending process. Trend obtained through this method cannot
be detected at the ends (12 h) of time series (at least not with high significance).
Figure 14.4a shows the trend data close following of raw data so that every
increase of water level/pressure of water column due to rainfall or every decrease due
to groundwater depletion is removed for insulating the diurnal signal. As a result,
detrended data are a succession of positive and negative values because of the mathematical operation of differencing (Fig. 14.4b). Detrended data lose their absolute
values, but retain amplitudes (however, they are neither standardized nor normalized time series). Detrended data are used for obtaining mean diurnal evolution of
a parameter. In order to preserve the original shape of data, time series smoothing
473
Fig. 14.3 Flowchart depicting the general steps used in obtaining the mean diurnal profiles
14.4.3 Methodology
The water sensors were placed in rivers with good water mixing at distances of up
to 1 m from banks and under water columns that usually varied from 0.1 to 1 m
thickness. The air sensors were generally placed at 2 m above terrain in shadowed
places and recipients made for avoiding raindrops and sunlight.
Raw data consist of consecutive days with measurements made during all 24 h
of a day. The general steps used for obtaining mean diurnal profiles are described in
Fig. 14.3. All data are set to EET—Eastern European Time (Standard Time); measurements done during EEST—Eastern European Summer Time (Daylight Saving
Time) had the time converted to EET. A common and unique time standard across
all sites is necessary in order to avoid the mismatch of processes, such as the moment
when peaks in the diurnal evolution occur.
In order to observe an abstract diurnal evolution of a parameter, we applied a
detrending to the time series by using XLSTAT software. Detrending is done by,
firstly, obtaining a relevant trend of the entire time series through an additive seasonal
decomposition which uses a period equal to the length of a day and by, secondly,
removing this trend from the raw time series. Additive decomposition was used
instead of the multiplicative one because the diurnal cycle has not amplitudes that
increase over time.
As a technical note, because of the length used as period for the detrending process,
the trend and detrended time series are shorter than raw data with the equivalent of
1 day. This happens because the first and last 12 h of the selected time interval are
removed during the detrending process. Trend obtained through this method cannot
be detected at the ends (12 h) of time series (at least not with high significance).
Figure 14.4a shows the trend data close following of raw data so that every
increase of water level/pressure of water column due to rainfall or every decrease due
to groundwater depletion is removed for insulating the diurnal signal. As a result,
detrended data are a succession of positive and negative values because of the mathematical operation of differencing (Fig. 14.4b). Detrended data lose their absolute
values, but retain amplitudes (however, they are neither standardized nor normalized time series). Detrended data are used for obtaining mean diurnal evolution of
a parameter. In order to preserve the original shape of data, time series smoothing