

472
A.-E. Briciu et al.
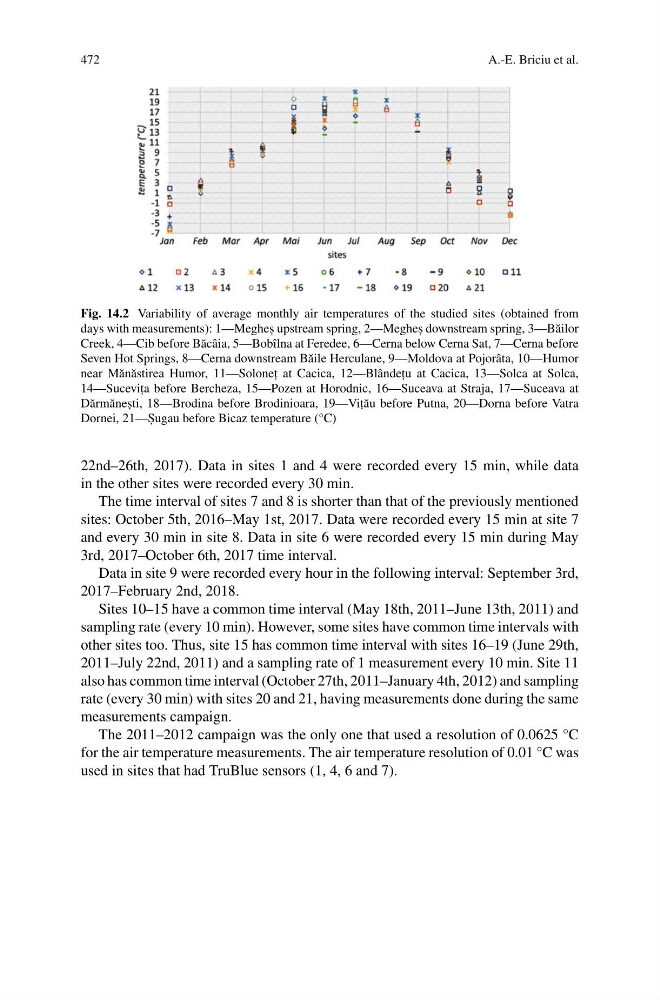
Fig. 14.2 Variability of average monthly air temperatures of the studied sites (obtained from
days with measurements): 1—Meghes , upstream spring, 2—Meghes , downstream spring, 3—B˘ ailor
Creek, 4—Cib before B˘ acâia, 5—Bobîlna at Feredee, 6—Cerna below Cerna Sat, 7—Cerna before
Seven Hot Springs, 8—Cerna downstream B˘ aile Herculane, 9—Moldova at Pojorâta, 10—Humor
near M˘ an˘ astirea Humor, 11—Solonet , at Cacica, 12—Blândet , u at Cacica, 13—Solca at Solca,
14—Sucevit , a before Bercheza, 15—Pozen at Horodnic, 16—Suceava at Straja, 17—Suceava at
D˘ arm˘ anes , ti, 18—Brodina before Brodinioara, 19—Vit , ˘
au before Putna, 20—Dorna before Vatra
Dornei, 21—S , ugau before Bicaz temperature (°C)
22nd–26th, 2017). Data in sites 1 and 4 were recorded every 15 min, while data
in the other sites were recorded every 30 min.
The time interval of sites 7 and 8 is shorter than that of the previously mentioned
sites: October 5th, 2016–May 1st, 2017. Data were recorded every 15 min at site 7
and every 30 min in site 8. Data in site 6 were recorded every 15 min during May
3rd, 2017–October 6th, 2017 time interval.
Data in site 9 were recorded every hour in the following interval: September 3rd,
2017–February 2nd, 2018.
Sites 10–15 have a common time interval (May 18th, 2011–June 13th, 2011) and
sampling rate (every 10 min). However, some sites have common time intervals with
other sites too. Thus, site 15 has common time interval with sites 16–19 (June 29th,
2011–July 22nd, 2011) and a sampling rate of 1 measurement every 10 min. Site 11
also has common time interval (October 27th, 2011–January 4th, 2012) and sampling
rate (every 30 min) with sites 20 and 21, having measurements done during the same
measurements campaign.
The 2011–2012 campaign was the only one that used a resolution of 0.0625 °C
for the air temperature measurements. The air temperature resolution of 0.01 °C was
used in sites that had TruBlue sensors (1, 4, 6 and 7).
A.-E. Briciu et al.
Fig. 14.2 Variability of average monthly air temperatures of the studied sites (obtained from
days with measurements): 1—Meghes , upstream spring, 2—Meghes , downstream spring, 3—B˘ ailor
Creek, 4—Cib before B˘ acâia, 5—Bobîlna at Feredee, 6—Cerna below Cerna Sat, 7—Cerna before
Seven Hot Springs, 8—Cerna downstream B˘ aile Herculane, 9—Moldova at Pojorâta, 10—Humor
near M˘ an˘ astirea Humor, 11—Solonet , at Cacica, 12—Blândet , u at Cacica, 13—Solca at Solca,
14—Sucevit , a before Bercheza, 15—Pozen at Horodnic, 16—Suceava at Straja, 17—Suceava at
D˘ arm˘ anes , ti, 18—Brodina before Brodinioara, 19—Vit , ˘
au before Putna, 20—Dorna before Vatra
Dornei, 21—S , ugau before Bicaz temperature (°C)
22nd–26th, 2017). Data in sites 1 and 4 were recorded every 15 min, while data
in the other sites were recorded every 30 min.
The time interval of sites 7 and 8 is shorter than that of the previously mentioned
sites: October 5th, 2016–May 1st, 2017. Data were recorded every 15 min at site 7
and every 30 min in site 8. Data in site 6 were recorded every 15 min during May
3rd, 2017–October 6th, 2017 time interval.
Data in site 9 were recorded every hour in the following interval: September 3rd,
2017–February 2nd, 2018.
Sites 10–15 have a common time interval (May 18th, 2011–June 13th, 2011) and
sampling rate (every 10 min). However, some sites have common time intervals with
other sites too. Thus, site 15 has common time interval with sites 16–19 (June 29th,
2011–July 22nd, 2011) and a sampling rate of 1 measurement every 10 min. Site 11
also has common time interval (October 27th, 2011–January 4th, 2012) and sampling
rate (every 30 min) with sites 20 and 21, having measurements done during the same
measurements campaign.
The 2011–2012 campaign was the only one that used a resolution of 0.0625 °C
for the air temperature measurements. The air temperature resolution of 0.01 °C was
used in sites that had TruBlue sensors (1, 4, 6 and 7).