

10 Hydrological Impacts of Climate Changes in Romania
315
10.3.1 Observed Climate Changes
Many previous studies have dealt with climatic variability in Romania based on
observational data, at a national or local scale. Several works investigated the variability of thermal parameters [99–106]. Many researches focused on the variability
of parameters related to precipitation [e.g., 107–111]. The temporal dynamics of
the snow pack was analyzed in [112–114]. Some studies have dealt with changes
in reference evapotranspiration [115] and analyzed the dynamic of the aridity, by
using different climate specific indices [116, 117]. The spatio-temporal variability
of dryness/wetness in the Danube River Basin (from 1901 to 2013) was analyzed
in [118] based on the Standardized Precipitation Index (SPI) for an accumulation
period of 6 months. Some studies analyzed the climatic variability and changes on
the whole Romanian territory by integrating several parameters [119–123] or at the
regional scale, such as the Carpathians [124–126].
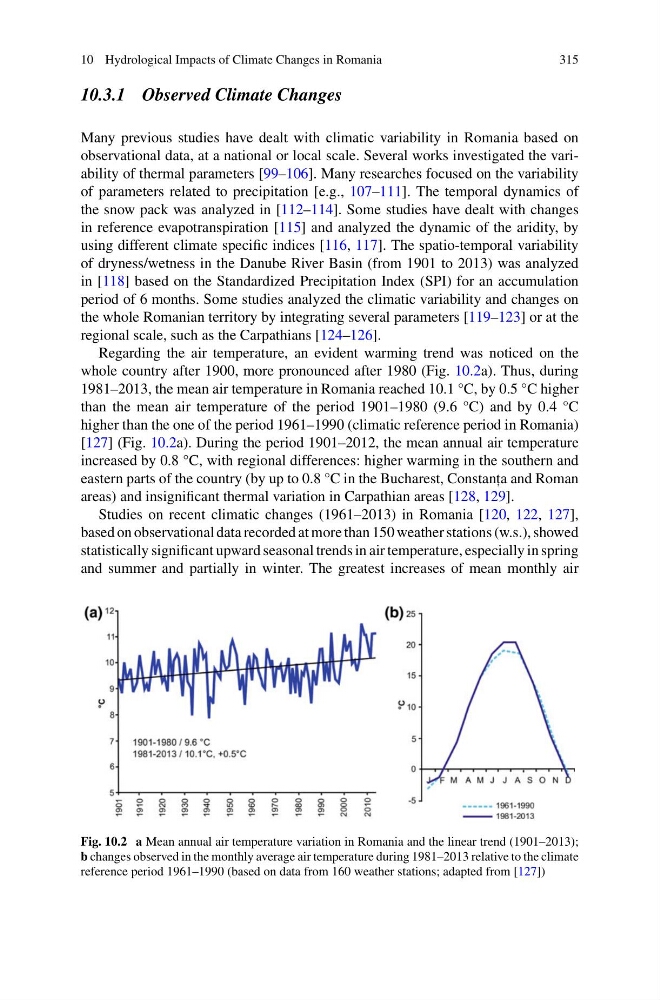
Regarding the air temperature, an evident warming trend was noticed on the
whole country after 1900, more pronounced after 1980 (Fig. 10.2a). Thus, during
1981–2013, the mean air temperature in Romania reached 10.1 °C, by 0.5 °C higher
than the mean air temperature of the period 1901–1980 (9.6 °C) and by 0.4 °C
higher than the one of the period 1961–1990 (climatic reference period in Romania)
[127] (Fig. 10.2a). During the period 1901–2012, the mean annual air temperature
increased by 0.8 °C, with regional differences: higher warming in the southern and
eastern parts of the country (by up to 0.8 °C in the Bucharest, Constant , a and Roman
areas) and insignificant thermal variation in Carpathian areas [128, 129].
Studies on recent climatic changes (1961–2013) in Romania [120, 122, 127],
based on observational data recorded at more than 150 weather stations (w.s.), showed
statistically significant upward seasonal trends in air temperature, especially in spring
and summer and partially in winter. The greatest increases of mean monthly air
Fig. 10.2 a Mean annual air temperature variation in Romania and the linear trend (1901–2013);
b changes observed in the monthly average air temperature during 1981–2013 relative to the climate
reference period 1961–1990 (based on data from 160 weather stations; adapted from [127])
315
10.3.1 Observed Climate Changes
Many previous studies have dealt with climatic variability in Romania based on
observational data, at a national or local scale. Several works investigated the variability of thermal parameters [99–106]. Many researches focused on the variability
of parameters related to precipitation [e.g., 107–111]. The temporal dynamics of
the snow pack was analyzed in [112–114]. Some studies have dealt with changes
in reference evapotranspiration [115] and analyzed the dynamic of the aridity, by
using different climate specific indices [116, 117]. The spatio-temporal variability
of dryness/wetness in the Danube River Basin (from 1901 to 2013) was analyzed
in [118] based on the Standardized Precipitation Index (SPI) for an accumulation
period of 6 months. Some studies analyzed the climatic variability and changes on
the whole Romanian territory by integrating several parameters [119–123] or at the
regional scale, such as the Carpathians [124–126].
Regarding the air temperature, an evident warming trend was noticed on the
whole country after 1900, more pronounced after 1980 (Fig. 10.2a). Thus, during
1981–2013, the mean air temperature in Romania reached 10.1 °C, by 0.5 °C higher
than the mean air temperature of the period 1901–1980 (9.6 °C) and by 0.4 °C
higher than the one of the period 1961–1990 (climatic reference period in Romania)
[127] (Fig. 10.2a). During the period 1901–2012, the mean annual air temperature
increased by 0.8 °C, with regional differences: higher warming in the southern and
eastern parts of the country (by up to 0.8 °C in the Bucharest, Constant , a and Roman
areas) and insignificant thermal variation in Carpathian areas [128, 129].
Studies on recent climatic changes (1961–2013) in Romania [120, 122, 127],
based on observational data recorded at more than 150 weather stations (w.s.), showed
statistically significant upward seasonal trends in air temperature, especially in spring
and summer and partially in winter. The greatest increases of mean monthly air
Fig. 10.2 a Mean annual air temperature variation in Romania and the linear trend (1901–2013);
b changes observed in the monthly average air temperature during 1981–2013 relative to the climate
reference period 1961–1990 (based on data from 160 weather stations; adapted from [127])