

69
surface areas (Table 4.5). The land use that gained area at the expense of scrubland
and grassland was agricultural (365.9 km
2
, 0.15% in TA, 14.9% in SD, and 85% in
LH) and urban (54.93 km
2
, 8% in SD, 92% in TA, and 0% in LH). There was also a
slight increase in areas covered with secondary scrub vegetation, 60.6 km
2
in LH
(8.25% of the land use change). As shown in Table 4.4, the largest land use changes
for agricultural plots replacing rangeland with primary vegetation coverage occurred
in LH, followed by SD and TA. Similarly, the loss of primary and secondary vegetation coverage to urban use was detected in the TA area, at the outskirts of the city of
Chihuahua, but this change was negligible for SD and LH areas.
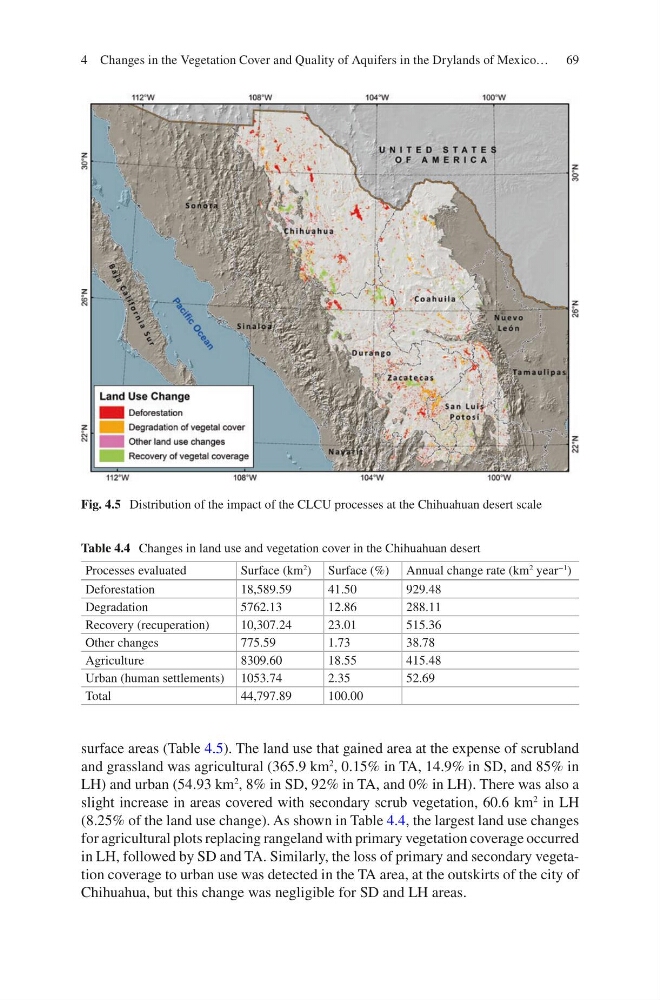
Fig. 4.5 Distribution of the impact of the CLCU processes at the Chihuahuan desert scale
Table 4.4 Changes in land use and vegetation cover in the Chihuahuan desert
Processes evaluated
Surface (km
2 ) Surface (%) Annual change rate (km
2 year
−1 )
Deforestation
18,589.59
41.50
929.48
Degradation
5762.13
12.86
288.11
Recovery (recuperation)
10,307.24
23.01
515.36
Other changes
775.59
1.73
38.78
Agriculture
8309.60
18.55
415.48
Urban (human settlements) 1053.74
2.35
52.69
Total
44,797.89
100.00
4 Changes in the Vegetation Cover and Quality of Aquifers in the Drylands of Mexico…
surface areas (Table 4.5). The land use that gained area at the expense of scrubland
and grassland was agricultural (365.9 km
2
, 0.15% in TA, 14.9% in SD, and 85% in
LH) and urban (54.93 km
2
, 8% in SD, 92% in TA, and 0% in LH). There was also a
slight increase in areas covered with secondary scrub vegetation, 60.6 km
2
in LH
(8.25% of the land use change). As shown in Table 4.4, the largest land use changes
for agricultural plots replacing rangeland with primary vegetation coverage occurred
in LH, followed by SD and TA. Similarly, the loss of primary and secondary vegetation coverage to urban use was detected in the TA area, at the outskirts of the city of
Chihuahua, but this change was negligible for SD and LH areas.
Fig. 4.5 Distribution of the impact of the CLCU processes at the Chihuahuan desert scale
Table 4.4 Changes in land use and vegetation cover in the Chihuahuan desert
Processes evaluated
Surface (km
2 ) Surface (%) Annual change rate (km
2 year
−1 )
Deforestation
18,589.59
41.50
929.48
Degradation
5762.13
12.86
288.11
Recovery (recuperation)
10,307.24
23.01
515.36
Other changes
775.59
1.73
38.78
Agriculture
8309.60
18.55
415.48
Urban (human settlements) 1053.74
2.35
52.69
Total
44,797.89
100.00
4 Changes in the Vegetation Cover and Quality of Aquifers in the Drylands of Mexico…