

70
Water Quality
Contaminants of higher significance because of their toxicity are As and F. As and
F levels above recommended limit in Mexico (0.025 mg L
−1
As and 1.5 mg L
−1
F)
were found to be common and widespread in all three aquifers, with the highest
levels of WQI recorded in LH (Fig. 4.6). The LH aquifer showed high content of
SO 4 and Na in some wells, a common occurrence in endorheic basins in an arid
environment. The water quality data show concentrations above recommended limit
of F in most wells. The values obtained for As also indicated conditions above its
recommended limit (29% times in TA, 42% in SD, and 68% in LH). These two
contaminants co-occur (r = 0.66, p < 0.001). Cl on the other hand stayed under the
limiting value of 250 mg L
−1
in all wells, while pH, TH, TDS, SO 4 , and Na content
remained also below the recommended limits for most samples.
The location of wells with higher concentration of the contaminant of likely
anthropogenic origin, nitrate, was superimposed on land use change (Fig. 4.7) to
better visualize possible relationships. Nitrate was found within the recommended
limit (<10 mg L
−1
) in all but one well, and while not a health threat, its presence suggests discharge of contaminated water from the surface and lixiviation into the aquifer. Nitrate concentrations >4 mg L
−1
were detected on nine sampling occasions in
three out of the 15 wells sampled for nitrate (wells 57SD, 67H, and 72H in Fig. 4.7).
Nitrate high values correspond to agricultural areas or green areas within the city
watered with reclaimed water; however, this relationship is inconclusive due to the
small number of data. More measurements are needed to test this assumption.
Discussion
The mean annual rates of average depletion obtained for the TA, SD, and LH of
1.49, 2.38, and 1.97 m year
−1
(Ada, Table 4.3) indicate severe overexploitation,
considering that horizontal groundwater flows are almost negligible, precipitation
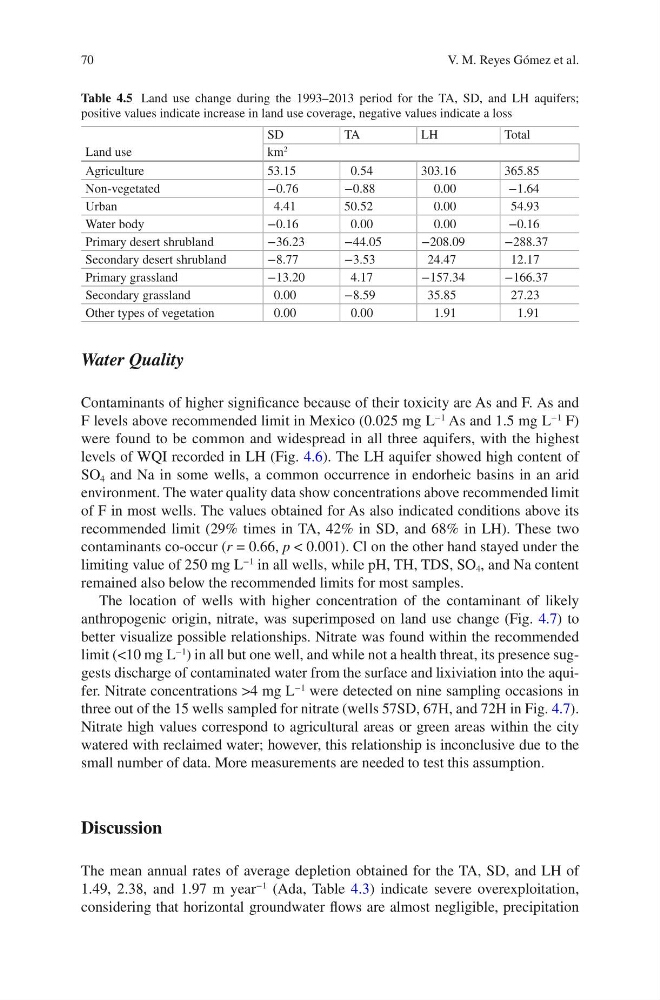
Table 4.5 Land use change during the 1993–2013 period for the TA, SD, and LH aquifers;
positive values indicate increase in land use coverage, negative values indicate a loss
Land use
SD
TA
LH
Total
km
2
Agriculture
53.15
0.54
303.16
365.85
Non-vegetated
−0.76
−0.88
0.00
−1.64
Urban
4.41
50.52
0.00
54.93
Water body
−0.16
0.00
0.00
−0.16
Primary desert shrubland
−36.23
−44.05
−208.09
−288.37
Secondary desert shrubland
−8.77
−3.53
24.47
12.17
Primary grassland
−13.20
4.17
−157.34
−166.37
Secondary grassland
0.00
−8.59
35.85
27.23
Other types of vegetation
0.00
0.00
1.91
1.91
V. M. Reyes Gómez et al.
Water Quality
Contaminants of higher significance because of their toxicity are As and F. As and
F levels above recommended limit in Mexico (0.025 mg L
−1
As and 1.5 mg L
−1
F)
were found to be common and widespread in all three aquifers, with the highest
levels of WQI recorded in LH (Fig. 4.6). The LH aquifer showed high content of
SO 4 and Na in some wells, a common occurrence in endorheic basins in an arid
environment. The water quality data show concentrations above recommended limit
of F in most wells. The values obtained for As also indicated conditions above its
recommended limit (29% times in TA, 42% in SD, and 68% in LH). These two
contaminants co-occur (r = 0.66, p < 0.001). Cl on the other hand stayed under the
limiting value of 250 mg L
−1
in all wells, while pH, TH, TDS, SO 4 , and Na content
remained also below the recommended limits for most samples.
The location of wells with higher concentration of the contaminant of likely
anthropogenic origin, nitrate, was superimposed on land use change (Fig. 4.7) to
better visualize possible relationships. Nitrate was found within the recommended
limit (<10 mg L
−1
) in all but one well, and while not a health threat, its presence suggests discharge of contaminated water from the surface and lixiviation into the aquifer. Nitrate concentrations >4 mg L
−1
were detected on nine sampling occasions in
three out of the 15 wells sampled for nitrate (wells 57SD, 67H, and 72H in Fig. 4.7).
Nitrate high values correspond to agricultural areas or green areas within the city
watered with reclaimed water; however, this relationship is inconclusive due to the
small number of data. More measurements are needed to test this assumption.
Discussion
The mean annual rates of average depletion obtained for the TA, SD, and LH of
1.49, 2.38, and 1.97 m year
−1
(Ada, Table 4.3) indicate severe overexploitation,
considering that horizontal groundwater flows are almost negligible, precipitation
Table 4.5 Land use change during the 1993–2013 period for the TA, SD, and LH aquifers;
positive values indicate increase in land use coverage, negative values indicate a loss
Land use
SD
TA
LH
Total
km
2
Agriculture
53.15
0.54
303.16
365.85
Non-vegetated
−0.76
−0.88
0.00
−1.64
Urban
4.41
50.52
0.00
54.93
Water body
−0.16
0.00
0.00
−0.16
Primary desert shrubland
−36.23
−44.05
−208.09
−288.37
Secondary desert shrubland
−8.77
−3.53
24.47
12.17
Primary grassland
−13.20
4.17
−157.34
−166.37
Secondary grassland
0.00
−8.59
35.85
27.23
Other types of vegetation
0.00
0.00
1.91
1.91
V. M. Reyes Gómez et al.