

68
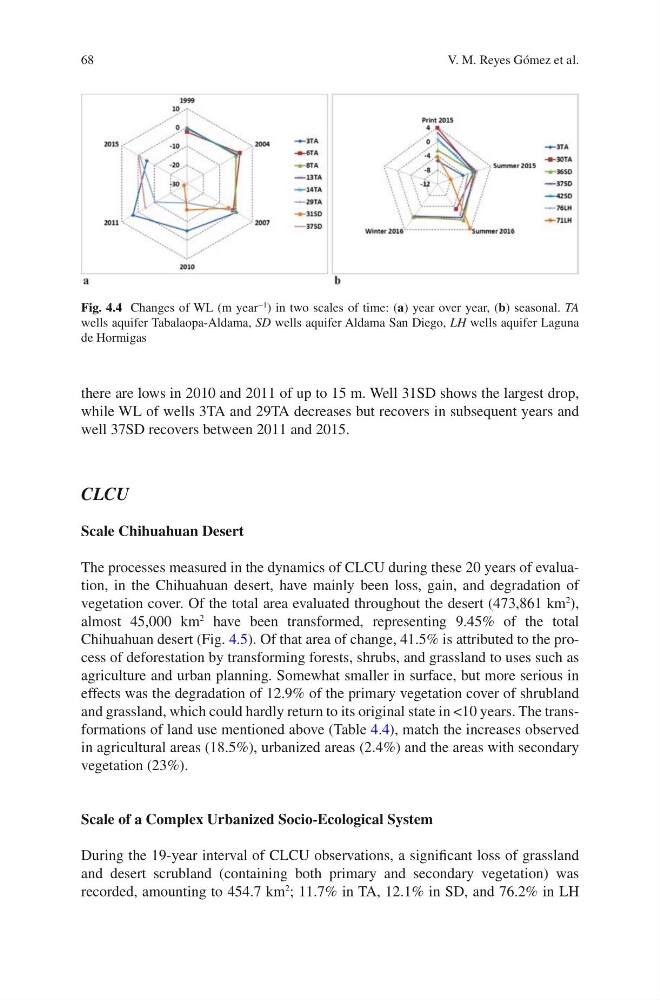
there are lows in 2010 and 2011 of up to 15 m. Well 31SD shows the largest drop,
while WL of wells 3TA and 29TA decreases but recovers in subsequent years and
well 37SD recovers between 2011 and 2015.
CLCU
Scale Chihuahuan Desert
The processes measured in the dynamics of CLCU during these 20 years of evaluation, in the Chihuahuan desert, have mainly been loss, gain, and degradation of
vegetation cover. Of the total area evaluated throughout the desert (473,861 km
2
),
almost 45,000 km
2
have been transformed, representing 9.45% of the total
Chihuahuan desert (Fig. 4.5). Of that area of change, 41.5% is attributed to the process of deforestation by transforming forests, shrubs, and grassland to uses such as
agriculture and urban planning. Somewhat smaller in surface, but more serious in
effects was the degradation of 12.9% of the primary vegetation cover of shrubland
and grassland, which could hardly return to its original state in <10 years. The transformations of land use mentioned above (Table 4.4), match the increases observed
in agricultural areas (18.5%), urbanized areas (2.4%) and the areas with secondary
vegetation (23%).
Scale of a Complex Urbanized Socio-Ecological System
During the 19-year interval of CLCU observations, a significant loss of grassland
and desert scrubland (containing both primary and secondary vegetation) was
recorded, amounting to 454.7 km
2
; 11.7% in TA, 12.1% in SD, and 76.2% in LH
Fig. 4.4 Changes of WL (m year
−1 ) in two scales of time: (a) year over year, (b) seasonal. TA
wells aquifer Tabalaopa-Aldama, SD wells aquifer Aldama San Diego, LH wells aquifer Laguna
de Hormigas
V. M. Reyes Gómez et al.
there are lows in 2010 and 2011 of up to 15 m. Well 31SD shows the largest drop,
while WL of wells 3TA and 29TA decreases but recovers in subsequent years and
well 37SD recovers between 2011 and 2015.
CLCU
Scale Chihuahuan Desert
The processes measured in the dynamics of CLCU during these 20 years of evaluation, in the Chihuahuan desert, have mainly been loss, gain, and degradation of
vegetation cover. Of the total area evaluated throughout the desert (473,861 km
2
),
almost 45,000 km
2
have been transformed, representing 9.45% of the total
Chihuahuan desert (Fig. 4.5). Of that area of change, 41.5% is attributed to the process of deforestation by transforming forests, shrubs, and grassland to uses such as
agriculture and urban planning. Somewhat smaller in surface, but more serious in
effects was the degradation of 12.9% of the primary vegetation cover of shrubland
and grassland, which could hardly return to its original state in <10 years. The transformations of land use mentioned above (Table 4.4), match the increases observed
in agricultural areas (18.5%), urbanized areas (2.4%) and the areas with secondary
vegetation (23%).
Scale of a Complex Urbanized Socio-Ecological System
During the 19-year interval of CLCU observations, a significant loss of grassland
and desert scrubland (containing both primary and secondary vegetation) was
recorded, amounting to 454.7 km
2
; 11.7% in TA, 12.1% in SD, and 76.2% in LH
Fig. 4.4 Changes of WL (m year
−1 ) in two scales of time: (a) year over year, (b) seasonal. TA
wells aquifer Tabalaopa-Aldama, SD wells aquifer Aldama San Diego, LH wells aquifer Laguna
de Hormigas
V. M. Reyes Gómez et al.