

312
Coastal Sensitivity
A sensitivity index was calculated by the combination of four indicators: littoral
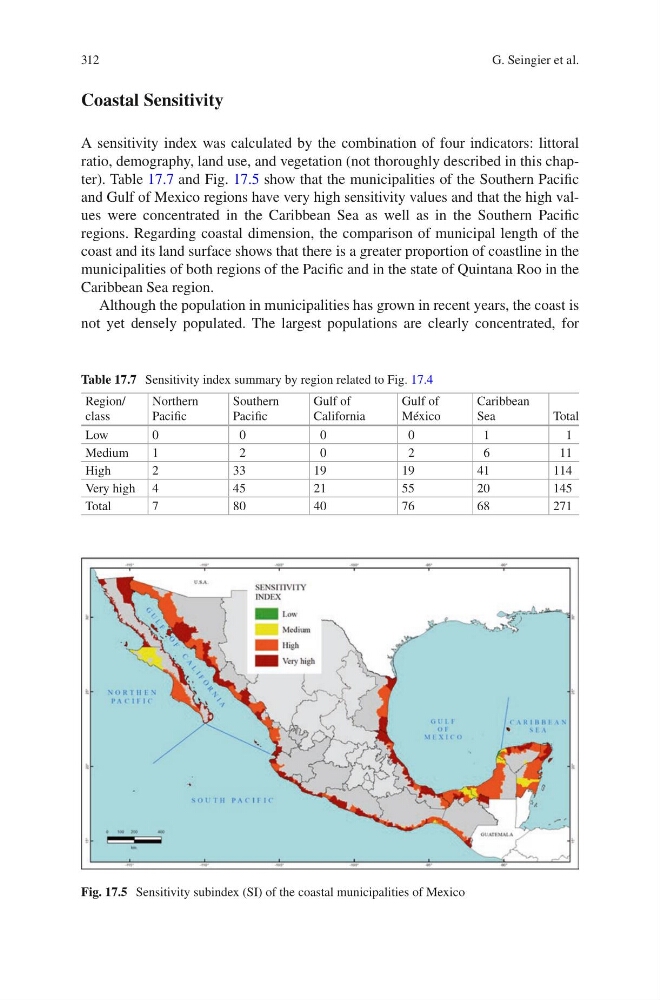
ratio, demography, land use, and vegetation (not thoroughly described in this chapter). Table 17.7 and Fig. 17.5 show that the municipalities of the Southern Pacific
and Gulf of Mexico regions have very high sensitivity values and that the high values were concentrated in the Caribbean Sea as well as in the Southern Pacific
regions. Regarding coastal dimension, the comparison of municipal length of the
coast and its land surface shows that there is a greater proportion of coastline in the
municipalities of both regions of the Pacific and in the state of Quintana Roo in the
Caribbean Sea region.
Although the population in municipalities has grown in recent years, the coast is
not yet densely populated. The largest populations are clearly concentrated, for
Table 17.7 Sensitivity index summary by region related to Fig. 17.4
Region/
class
Northern
Pacific
Southern
Pacific
Gulf of
California
Gulf of
México
Caribbean
Sea
Total
Low
0
0
0
0
1
1
Medium
1
2
0
2
6
11
High
2
33
19
19
41
114
Very high 4
45
21
55
20
145
Total
7
80
40
76
68
271
Fig. 17.5 Sensitivity subindex (SI) of the coastal municipalities of Mexico
G. Seingier et al.
Coastal Sensitivity
A sensitivity index was calculated by the combination of four indicators: littoral
ratio, demography, land use, and vegetation (not thoroughly described in this chapter). Table 17.7 and Fig. 17.5 show that the municipalities of the Southern Pacific
and Gulf of Mexico regions have very high sensitivity values and that the high values were concentrated in the Caribbean Sea as well as in the Southern Pacific
regions. Regarding coastal dimension, the comparison of municipal length of the
coast and its land surface shows that there is a greater proportion of coastline in the
municipalities of both regions of the Pacific and in the state of Quintana Roo in the
Caribbean Sea region.
Although the population in municipalities has grown in recent years, the coast is
not yet densely populated. The largest populations are clearly concentrated, for
Table 17.7 Sensitivity index summary by region related to Fig. 17.4
Region/
class
Northern
Pacific
Southern
Pacific
Gulf of
California
Gulf of
México
Caribbean
Sea
Total
Low
0
0
0
0
1
1
Medium
1
2
0
2
6
11
High
2
33
19
19
41
114
Very high 4
45
21
55
20
145
Total
7
80
40
76
68
271
Fig. 17.5 Sensitivity subindex (SI) of the coastal municipalities of Mexico
G. Seingier et al.