

292
Aridity Indices: Change/Difference and Trends In and Out
of Communal Lands in Mexico Between 1961 and 2017
The results for the aridity index averages for communal versus non-communal lands
Mexico are presented in Tables 16.1 and 16.2. Table 16.1 (RAN) shows the more
liberal of the definitions of communal lands (Communal_RAN, which includes
settlements, and “privatized” parceled lands), whereas Table 16.2 only includes a
subset of RAN, composed of lands allocated to communal use within an ejido (i.e.,
tierras de uso común, Communal_TUC). The lands that are not communal or part of
ejidos are labeled as REST in both cases. REST includes both government and private lands. The analysis that follows compares the aridity metrics on the communal
fields (RAN or TUC) versus those in REST.
The results show that there has been a decrease in the aridity index from the
1961–1990 period to the 1991–2017 in all categories shown in both tables (total
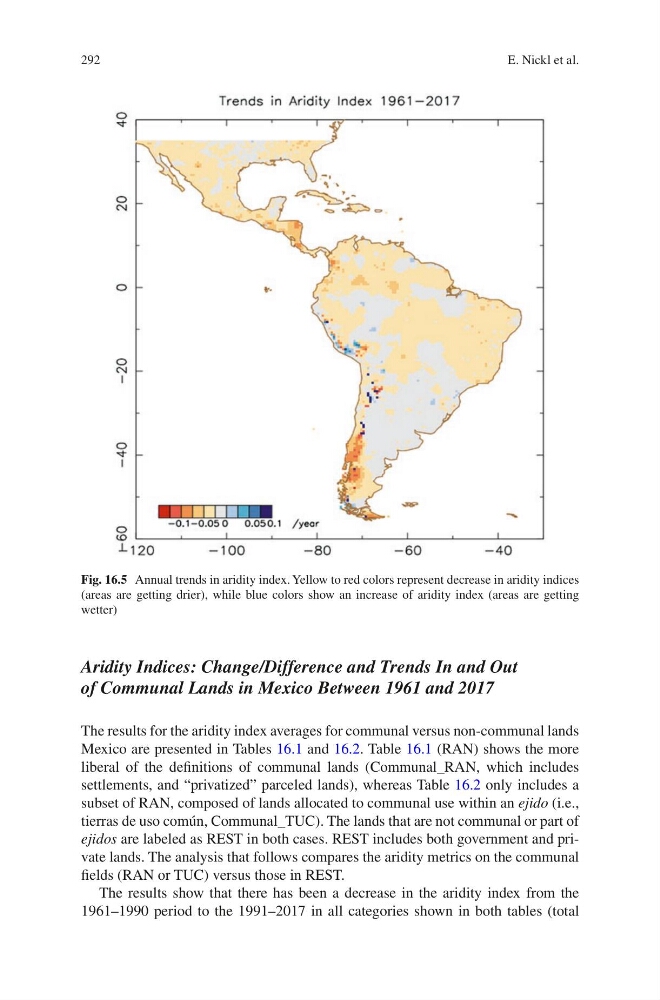
Fig. 16.5 Annual trends in aridity index. Yellow to red colors represent decrease in aridity indices
(areas are getting drier), while blue colors show an increase of aridity index (areas are getting
wetter)
E. Nickl et al.
Aridity Indices: Change/Difference and Trends In and Out
of Communal Lands in Mexico Between 1961 and 2017
The results for the aridity index averages for communal versus non-communal lands
Mexico are presented in Tables 16.1 and 16.2. Table 16.1 (RAN) shows the more
liberal of the definitions of communal lands (Communal_RAN, which includes
settlements, and “privatized” parceled lands), whereas Table 16.2 only includes a
subset of RAN, composed of lands allocated to communal use within an ejido (i.e.,
tierras de uso común, Communal_TUC). The lands that are not communal or part of
ejidos are labeled as REST in both cases. REST includes both government and private lands. The analysis that follows compares the aridity metrics on the communal
fields (RAN or TUC) versus those in REST.
The results show that there has been a decrease in the aridity index from the
1961–1990 period to the 1991–2017 in all categories shown in both tables (total
Fig. 16.5 Annual trends in aridity index. Yellow to red colors represent decrease in aridity indices
(areas are getting drier), while blue colors show an increase of aridity index (areas are getting
wetter)
E. Nickl et al.