

291
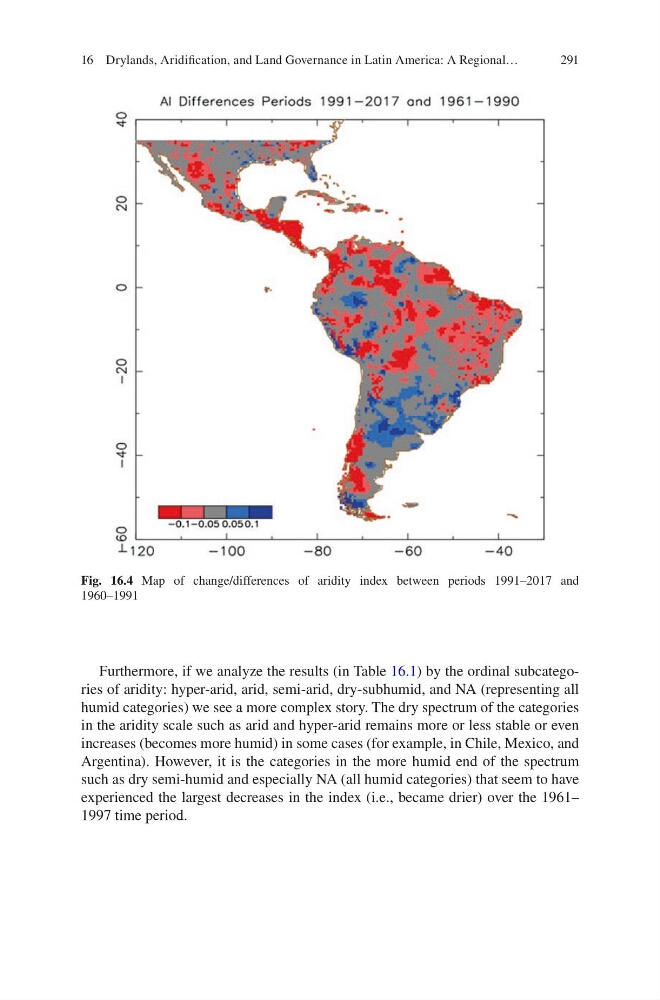
Furthermore, if we analyze the results (in Table 16.1) by the ordinal subcategories of aridity: hyper-arid, arid, semi-arid, dry-subhumid, and NA (representing all
humid categories) we see a more complex story. The dry spectrum of the categories
in the aridity scale such as arid and hyper-arid remains more or less stable or even
increases (becomes more humid) in some cases (for example, in Chile, Mexico, and
Argentina). However, it is the categories in the more humid end of the spectrum
such as dry semi-humid and especially NA (all humid categories) that seem to have
experienced the largest decreases in the index (i.e., became drier) over the 1961–
1997 time period.
Fig. 16.4 Map of change/differences of aridity index between periods 1991–2017 and
1960–1991
16 Drylands, Aridification, and Land Governance in Latin America: A Regional…
Furthermore, if we analyze the results (in Table 16.1) by the ordinal subcategories of aridity: hyper-arid, arid, semi-arid, dry-subhumid, and NA (representing all
humid categories) we see a more complex story. The dry spectrum of the categories
in the aridity scale such as arid and hyper-arid remains more or less stable or even
increases (becomes more humid) in some cases (for example, in Chile, Mexico, and
Argentina). However, it is the categories in the more humid end of the spectrum
such as dry semi-humid and especially NA (all humid categories) that seem to have
experienced the largest decreases in the index (i.e., became drier) over the 1961–
1997 time period.
Fig. 16.4 Map of change/differences of aridity index between periods 1991–2017 and
1960–1991
16 Drylands, Aridification, and Land Governance in Latin America: A Regional…