

132
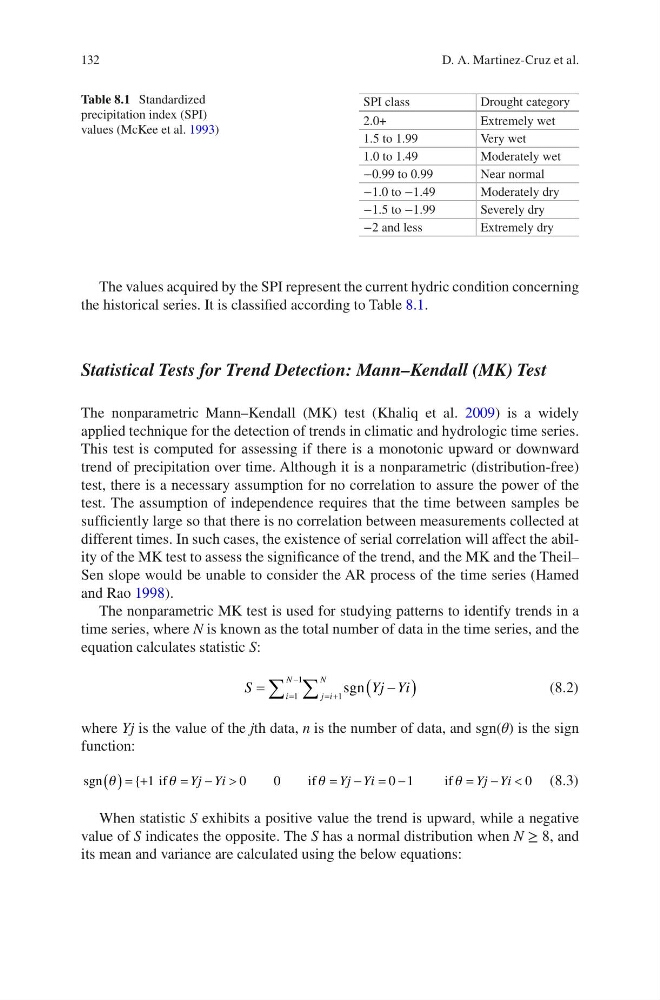
The values acquired by the SPI represent the current hydric condition concerning
the historical series. It is classified according to Table 8.1.
Statistical Tests for Trend Detection: Mann–Kendall (MK) Test
The nonparametric Mann–Kendall (MK) test (Khaliq et al. 2009) is a widely
applied technique for the detection of trends in climatic and hydrologic time series.
This test is computed for assessing if there is a monotonic upward or downward
trend of precipitation over time. Although it is a nonparametric (distribution-free)
test, there is a necessary assumption for no correlation to assure the power of the
test. The assumption of independence requires that the time between samples be
sufficiently large so that there is no correlation between measurements collected at
different times. In such cases, the existence of serial correlation will affect the ability of the MK test to assess the significance of the trend, and the MK and the Theil–
Sen slope would be unable to consider the AR process of the time series (Hamed
and Rao 1998).
The nonparametric MK test is used for studying patterns to identify trends in a
time series, where N is known as the total number of data in the time series, and the
equation calculates statistic S:
S
Y j Yi
i
N
j i
N
=
-
(
)
=
-
= +
å å
1
1
1
sgn
(8.2)
where Yj is the value of the jth data, n is the number of data, and sgn(θ) is the sign
function:
sgn
{
q
q
q
q
( ) = +
= - >
= - = -
= - <
1
0
0
01
0
if
if
if
Yj Yi
Yj Yi
Yj Yi
(8.3)
When statistic S exhibits a positive value the trend is upward, while a negative
value of S indicates the opposite. The S has a normal distribution when N ≥ 8, and
its mean and variance are calculated using the below equations:
Table 8.1 Standardized
precipitation index (SPI)
values (McKee et al. 1993)
SPI class
Drought category
2.0+
Extremely wet
1.5 to 1.99
Very wet
1.0 to 1.49
Moderately wet
−0.99 to 0.99
Near normal
−1.0 to −1.49
Moderately dry
−1.5 to −1.99
Severely dry
−2 and less
Extremely dry
D. A. Martinez-Cruz et al.
The values acquired by the SPI represent the current hydric condition concerning
the historical series. It is classified according to Table 8.1.
Statistical Tests for Trend Detection: Mann–Kendall (MK) Test
The nonparametric Mann–Kendall (MK) test (Khaliq et al. 2009) is a widely
applied technique for the detection of trends in climatic and hydrologic time series.
This test is computed for assessing if there is a monotonic upward or downward
trend of precipitation over time. Although it is a nonparametric (distribution-free)
test, there is a necessary assumption for no correlation to assure the power of the
test. The assumption of independence requires that the time between samples be
sufficiently large so that there is no correlation between measurements collected at
different times. In such cases, the existence of serial correlation will affect the ability of the MK test to assess the significance of the trend, and the MK and the Theil–
Sen slope would be unable to consider the AR process of the time series (Hamed
and Rao 1998).
The nonparametric MK test is used for studying patterns to identify trends in a
time series, where N is known as the total number of data in the time series, and the
equation calculates statistic S:
S
Y j Yi
i
N
j i
N
=
-
(
)
=
-
= +
å å
1
1
1
sgn
(8.2)
where Yj is the value of the jth data, n is the number of data, and sgn(θ) is the sign
function:
sgn
{
q
q
q
q
( ) = +
= - >
= - = -
= - <
1
0
0
01
0
if
if
if
Yj Yi
Yj Yi
Yj Yi
(8.3)
When statistic S exhibits a positive value the trend is upward, while a negative
value of S indicates the opposite. The S has a normal distribution when N ≥ 8, and
its mean and variance are calculated using the below equations:
Table 8.1 Standardized
precipitation index (SPI)
values (McKee et al. 1993)
SPI class
Drought category
2.0+
Extremely wet
1.5 to 1.99
Very wet
1.0 to 1.49
Moderately wet
−0.99 to 0.99
Near normal
−1.0 to −1.49
Moderately dry
−1.5 to −1.99
Severely dry
−2 and less
Extremely dry
D. A. Martinez-Cruz et al.