

131
resources and compromises the sustainability of the socio-ecological systems of the
region. The analysis of documented droughts could help provide an early diagnostic, identify the zones facing a higher risk of drought, and provide the information
needed by management programs to cope with its adverse effects. Currently, geographic information systems (GIS) and remote sensing (RS) have been fundamental
in studying different types of hazards, either natural or anthropogenic. This study
emphasizes the application of RS and GIS in the field of drought risk evaluation to
better understand the spatial and temporal variability of rainfall and drought trends
over these predominantly arid and semi-arid zones with otherwise limited precipitation (gauging) data.
Materials and Methods
Standardized Precipitation Index (SPI)
McKee et al. (1993) developed the standardized precipitation index (SPI) to define
and monitor droughts (Ghosh and Mujumdar 2007). In the last decade, the SPI
became the most popular drought index, based on its theoretical development,
robustness, and versatility for drought analysis (Rivera and Penalba 2014). The SPI
represents the number of standard deviations from which a precipitation value is
above or below the climatological average of a particular location. For the calculation of the SPI, the accumulated rainfall series on different timescales are divided
into 12 monthly series, which are adjusted to a theoretical probability distribution
that represents the variations of rainfall in the study region. In this study, the twoparameter gamma distribution was used because of its known capability for modeling the variability in precipitation of long-term rainfall series in semi-arid zones of
Mexico (Mosiño Alemán and Garcia 1981). The gamma probability distribution of
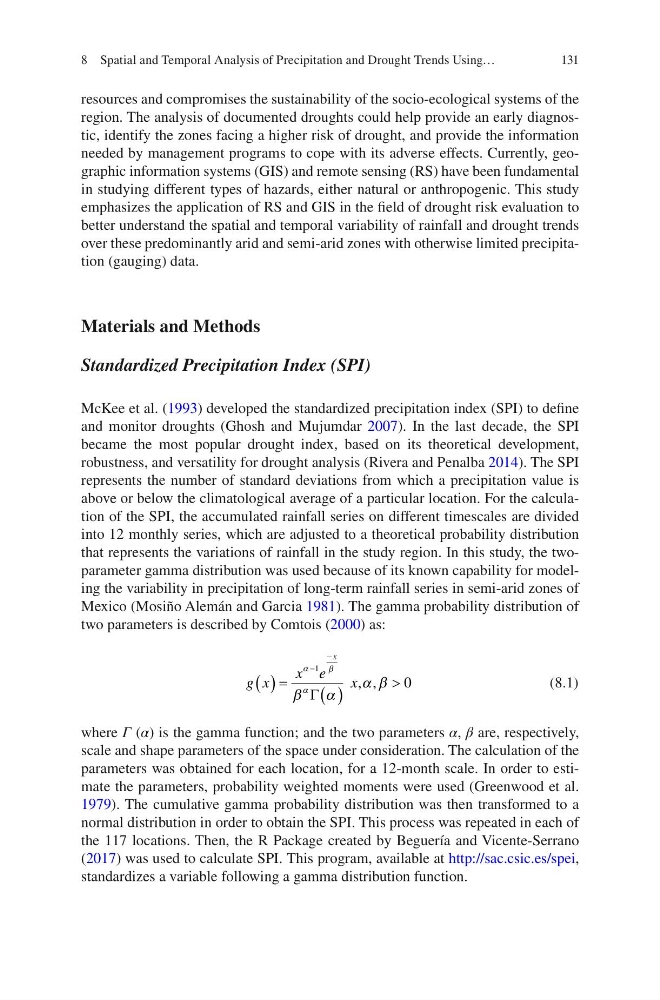
two parameters is described by Comtois (2000) as:
g x
x e
x
x
( ) =
( )
>
-
-
a
b
a
b
a
a b
1
0
G
, ,
(8.1)
where Γ (α) is the gamma function; and the two parameters α, β are, respectively,
scale and shape parameters of the space under consideration. The calculation of the
parameters was obtained for each location, for a 12-month scale. In order to estimate the parameters, probability weighted moments were used (Greenwood et al.
1979). The cumulative gamma probability distribution was then transformed to a
normal distribution in order to obtain the SPI. This process was repeated in each of
the 117 locations. Then, the R Package created by Beguería and Vicente-Serrano
(2017) was used to calculate SPI. This program, available at http://sac.csic.es/spei,
standardizes a variable following a gamma distribution function.
8 Spatial and Temporal Analysis of Precipitation and Drought Trends Using…
resources and compromises the sustainability of the socio-ecological systems of the
region. The analysis of documented droughts could help provide an early diagnostic, identify the zones facing a higher risk of drought, and provide the information
needed by management programs to cope with its adverse effects. Currently, geographic information systems (GIS) and remote sensing (RS) have been fundamental
in studying different types of hazards, either natural or anthropogenic. This study
emphasizes the application of RS and GIS in the field of drought risk evaluation to
better understand the spatial and temporal variability of rainfall and drought trends
over these predominantly arid and semi-arid zones with otherwise limited precipitation (gauging) data.
Materials and Methods
Standardized Precipitation Index (SPI)
McKee et al. (1993) developed the standardized precipitation index (SPI) to define
and monitor droughts (Ghosh and Mujumdar 2007). In the last decade, the SPI
became the most popular drought index, based on its theoretical development,
robustness, and versatility for drought analysis (Rivera and Penalba 2014). The SPI
represents the number of standard deviations from which a precipitation value is
above or below the climatological average of a particular location. For the calculation of the SPI, the accumulated rainfall series on different timescales are divided
into 12 monthly series, which are adjusted to a theoretical probability distribution
that represents the variations of rainfall in the study region. In this study, the twoparameter gamma distribution was used because of its known capability for modeling the variability in precipitation of long-term rainfall series in semi-arid zones of
Mexico (Mosiño Alemán and Garcia 1981). The gamma probability distribution of
two parameters is described by Comtois (2000) as:
g x
x e
x
x
( ) =
( )
>
-
-
a
b
a
b
a
a b
1
0
G
, ,
(8.1)
where Γ (α) is the gamma function; and the two parameters α, β are, respectively,
scale and shape parameters of the space under consideration. The calculation of the
parameters was obtained for each location, for a 12-month scale. In order to estimate the parameters, probability weighted moments were used (Greenwood et al.
1979). The cumulative gamma probability distribution was then transformed to a
normal distribution in order to obtain the SPI. This process was repeated in each of
the 117 locations. Then, the R Package created by Beguería and Vicente-Serrano
(2017) was used to calculate SPI. This program, available at http://sac.csic.es/spei,
standardizes a variable following a gamma distribution function.
8 Spatial and Temporal Analysis of Precipitation and Drought Trends Using…