

For wet deposition, Liu et al. (2017b) estimated bulk N deposition using OMI
NO 2 columns and precipitation amounts by mixed effect models. The proposed
mixed effect models can gain a relatively high accuracy of estimating bulk N
deposition in China (R ¼ 0.83, RMSE ¼ 0.72 kg N ha
À1
), suggesting the satellite
observation can be used to estimate wet N deposition. The average of bulk NO 3
À
deposition was 5.77 kg N ha
À1 year
À1 (0.01–26.76 kg N ha
À1 year
À1 ) during
2010–2012 (Fig. 3.7).
3.5 Nitrogen Deposition to China’s Coastal Seas
3.5.1 Wet Deposition to China’s Coastal Regions
Rapid industrialization and intensified agricultural activities in mainland China have
substantially increased N r emissions (Liu et al. 2013) and elevated atmospheric
concentrations of NO x and NH 3 (Richter et al. 2005; Clarisse et al. 2009). High
concentrations of atmospheric N r can be transported and deposited to nearby coastal
seas and consequently affect their ecological processes (Duce et al. 2008; Liu et al.
2011; Kim et al. 2011, 2014; Zhao et al. 2015). Assessing the magnitudes and
patterns of N deposition to China’s coastal regions will help to understand how N
deposition affects the coastal and adjacent marine ecosystems. Due to the difficulty
in direct monitoring N deposition to the open sea, most insights into N deposition in
coastal seas are derived from observation data at sites along coastlines, augmented
by modelling.
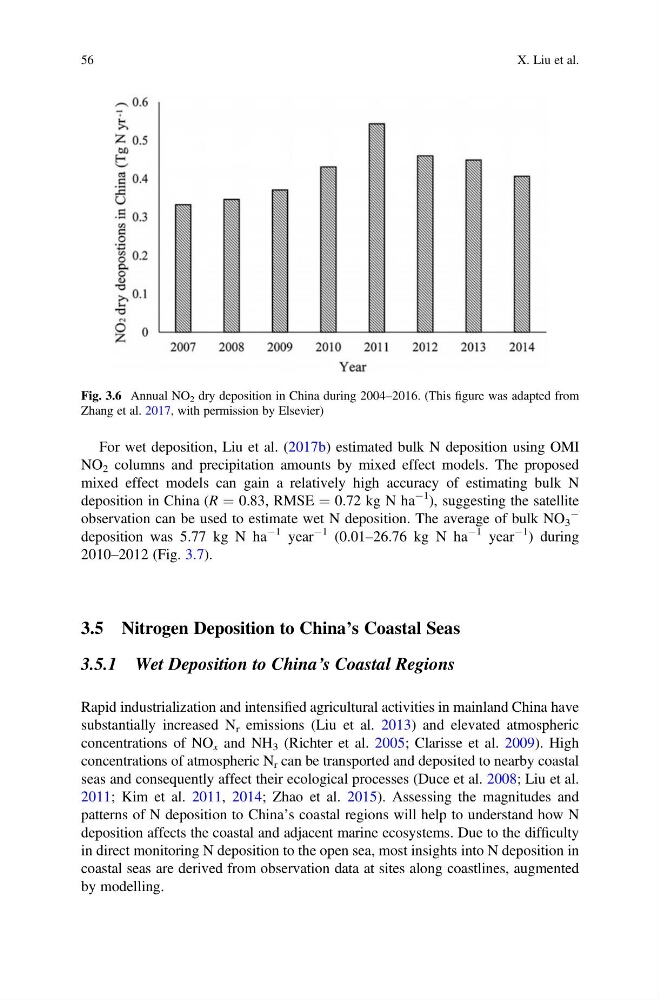
Fig. 3.6 Annual NO 2 dry deposition in China during 2004–2016. (This figure was adapted from
Zhang et al. 2017, with permission by Elsevier)
56
X. Liu et al.
NO 2 columns and precipitation amounts by mixed effect models. The proposed
mixed effect models can gain a relatively high accuracy of estimating bulk N
deposition in China (R ¼ 0.83, RMSE ¼ 0.72 kg N ha
À1
), suggesting the satellite
observation can be used to estimate wet N deposition. The average of bulk NO 3
À
deposition was 5.77 kg N ha
À1 year
À1 (0.01–26.76 kg N ha
À1 year
À1 ) during
2010–2012 (Fig. 3.7).
3.5 Nitrogen Deposition to China’s Coastal Seas
3.5.1 Wet Deposition to China’s Coastal Regions
Rapid industrialization and intensified agricultural activities in mainland China have
substantially increased N r emissions (Liu et al. 2013) and elevated atmospheric
concentrations of NO x and NH 3 (Richter et al. 2005; Clarisse et al. 2009). High
concentrations of atmospheric N r can be transported and deposited to nearby coastal
seas and consequently affect their ecological processes (Duce et al. 2008; Liu et al.
2011; Kim et al. 2011, 2014; Zhao et al. 2015). Assessing the magnitudes and
patterns of N deposition to China’s coastal regions will help to understand how N
deposition affects the coastal and adjacent marine ecosystems. Due to the difficulty
in direct monitoring N deposition to the open sea, most insights into N deposition in
coastal seas are derived from observation data at sites along coastlines, augmented
by modelling.
Fig. 3.6 Annual NO 2 dry deposition in China during 2004–2016. (This figure was adapted from
Zhang et al. 2017, with permission by Elsevier)
56
X. Liu et al.