

3.4.3 Satellite Monitoring N Deposition
Satellite observations can be used for estimating N r deposition. For instance, Nowlan
et al. (2014) used the satellite NO 2 columns to estimate surface NO 2 concentrations
combining GEOS-Chem, which were used to estimate the dry NO 2 deposition;
Geddes and Martin (2017) applied the satellite NO 2 measurements to calibrate
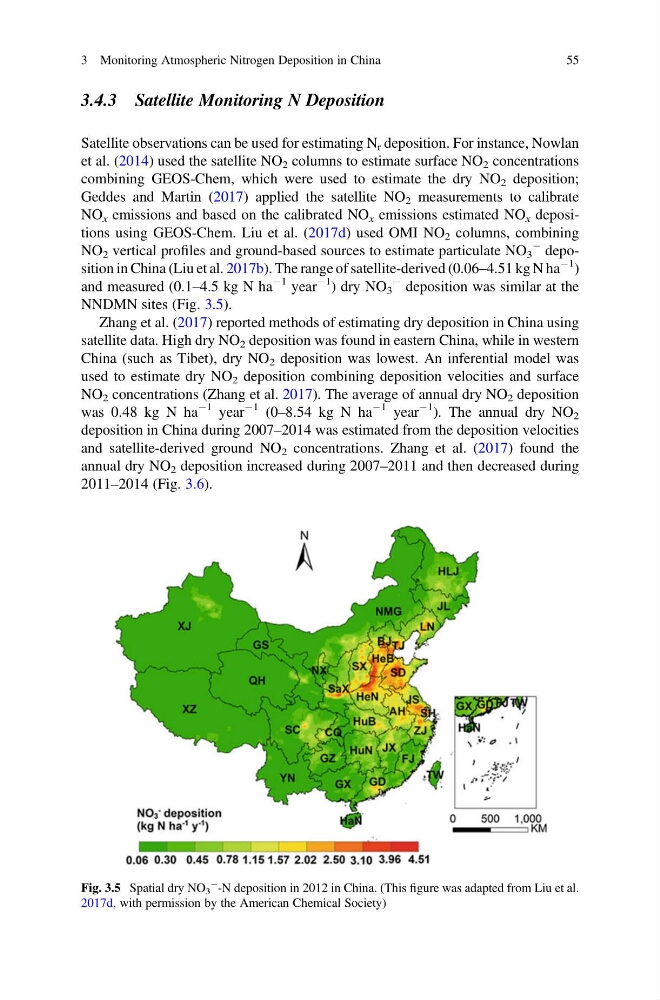
NO x emissions and based on the calibrated NO x emissions estimated NO x depositions using GEOS-Chem. Liu et al. (2017d) used OMI NO 2 columns, combining
NO 2 vertical profiles and ground-based sources to estimate particulate NO 3
À deposition in China (Liu et al. 2017b). The range of satellite-derived (0.06–4.51 kg N ha
À1 )
and measured (0.1–4.5 kg N ha
À1 year
À1 ) dry NO 3
À deposition was similar at the
NNDMN sites (Fig. 3.5).
Zhang et al. (2017) reported methods of estimating dry deposition in China using
satellite data. High dry NO 2 deposition was found in eastern China, while in western
China (such as Tibet), dry NO 2 deposition was lowest. An inferential model was
used to estimate dry NO 2 deposition combining deposition velocities and surface
NO 2 concentrations (Zhang et al. 2017). The average of annual dry NO 2 deposition
was 0.48 kg N ha
À1 year
À1 (0–8.54 kg N ha
À1 year
À1 ). The annual dry NO 2
deposition in China during 2007–2014 was estimated from the deposition velocities
and satellite-derived ground NO 2 concentrations. Zhang et al. (2017) found the
annual dry NO 2 deposition increased during 2007–2011 and then decreased during
2011–2014 (Fig. 3.6).
Fig. 3.5 Spatial dry NO 3
À -N deposition in 2012 in China. (This figure was adapted from Liu et al.
2017d, with permission by the American Chemical Society)
3 Monitoring Atmospheric Nitrogen Deposition in China
55
Satellite observations can be used for estimating N r deposition. For instance, Nowlan
et al. (2014) used the satellite NO 2 columns to estimate surface NO 2 concentrations
combining GEOS-Chem, which were used to estimate the dry NO 2 deposition;
Geddes and Martin (2017) applied the satellite NO 2 measurements to calibrate
NO x emissions and based on the calibrated NO x emissions estimated NO x depositions using GEOS-Chem. Liu et al. (2017d) used OMI NO 2 columns, combining
NO 2 vertical profiles and ground-based sources to estimate particulate NO 3
À deposition in China (Liu et al. 2017b). The range of satellite-derived (0.06–4.51 kg N ha
À1 )
and measured (0.1–4.5 kg N ha
À1 year
À1 ) dry NO 3
À deposition was similar at the
NNDMN sites (Fig. 3.5).
Zhang et al. (2017) reported methods of estimating dry deposition in China using
satellite data. High dry NO 2 deposition was found in eastern China, while in western
China (such as Tibet), dry NO 2 deposition was lowest. An inferential model was
used to estimate dry NO 2 deposition combining deposition velocities and surface
NO 2 concentrations (Zhang et al. 2017). The average of annual dry NO 2 deposition
was 0.48 kg N ha
À1 year
À1 (0–8.54 kg N ha
À1 year
À1 ). The annual dry NO 2
deposition in China during 2007–2014 was estimated from the deposition velocities
and satellite-derived ground NO 2 concentrations. Zhang et al. (2017) found the
annual dry NO 2 deposition increased during 2007–2011 and then decreased during
2011–2014 (Fig. 3.6).
Fig. 3.5 Spatial dry NO 3
À -N deposition in 2012 in China. (This figure was adapted from Liu et al.
2017d, with permission by the American Chemical Society)
3 Monitoring Atmospheric Nitrogen Deposition in China
55