

differ to some extent between the abovementioned research, the results are highly
comparable and thus can be taken as an accurate record of the magnitude of current
wet/bulk deposition in China.
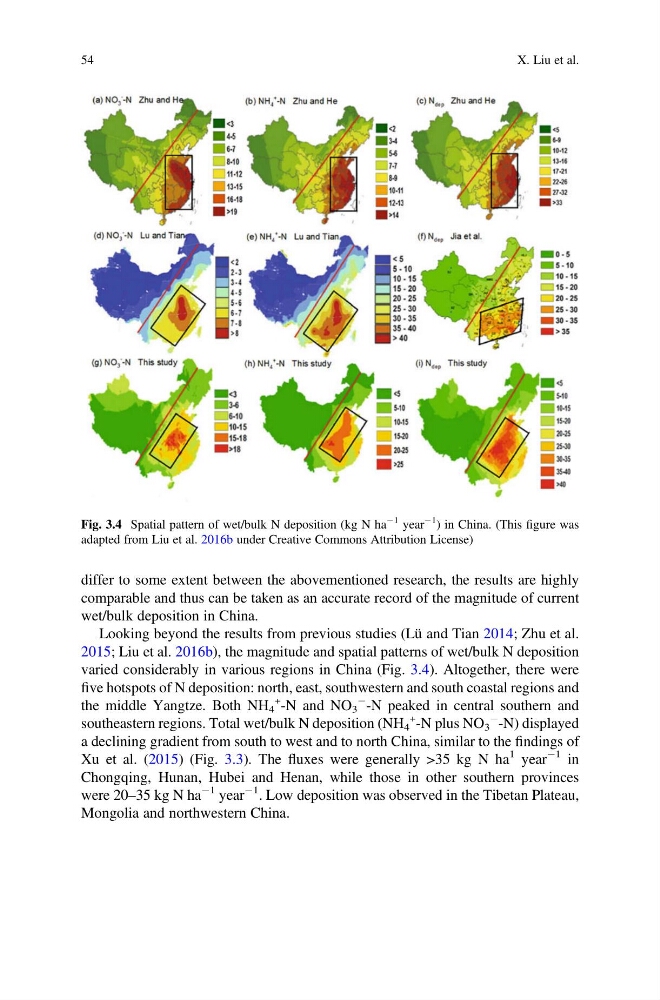
Looking beyond the results from previous studies (Lü and Tian 2014; Zhu et al.
2015; Liu et al. 2016b), the magnitude and spatial patterns of wet/bulk N deposition
varied considerably in various regions in China (Fig. 3.4). Altogether, there were
five hotspots of N deposition: north, east, southwestern and south coastal regions and
the middle Yangtze. Both NH 4
+
-N and NO 3
À -N peaked in central southern and
southeastern regions. Total wet/bulk N deposition (NH 4
+
-N plus NO 3
À
-N) displayed
a declining gradient from south to west and to north China, similar to the findings of
Xu et al. (2015) (Fig. 3.3). The fluxes were generally >35 kg N ha
1 year
À1 in
Chongqing, Hunan, Hubei and Henan, while those in other southern provinces
were 20–35 kg N ha
À1 year
À1 . Low deposition was observed in the Tibetan Plateau,
Mongolia and northwestern China.
Fig. 3.4 Spatial pattern of wet/bulk N deposition (kg N ha
À1 year
À1
) in China. (This figure was
adapted from Liu et al. 2016b under Creative Commons Attribution License)
54
X. Liu et al.
comparable and thus can be taken as an accurate record of the magnitude of current
wet/bulk deposition in China.
Looking beyond the results from previous studies (Lü and Tian 2014; Zhu et al.
2015; Liu et al. 2016b), the magnitude and spatial patterns of wet/bulk N deposition
varied considerably in various regions in China (Fig. 3.4). Altogether, there were
five hotspots of N deposition: north, east, southwestern and south coastal regions and
the middle Yangtze. Both NH 4
+
-N and NO 3
À -N peaked in central southern and
southeastern regions. Total wet/bulk N deposition (NH 4
+
-N plus NO 3
À
-N) displayed
a declining gradient from south to west and to north China, similar to the findings of
Xu et al. (2015) (Fig. 3.3). The fluxes were generally >35 kg N ha
1 year
À1 in
Chongqing, Hunan, Hubei and Henan, while those in other southern provinces
were 20–35 kg N ha
À1 year
À1 . Low deposition was observed in the Tibetan Plateau,
Mongolia and northwestern China.
Fig. 3.4 Spatial pattern of wet/bulk N deposition (kg N ha
À1 year
À1
) in China. (This figure was
adapted from Liu et al. 2016b under Creative Commons Attribution License)
54
X. Liu et al.