

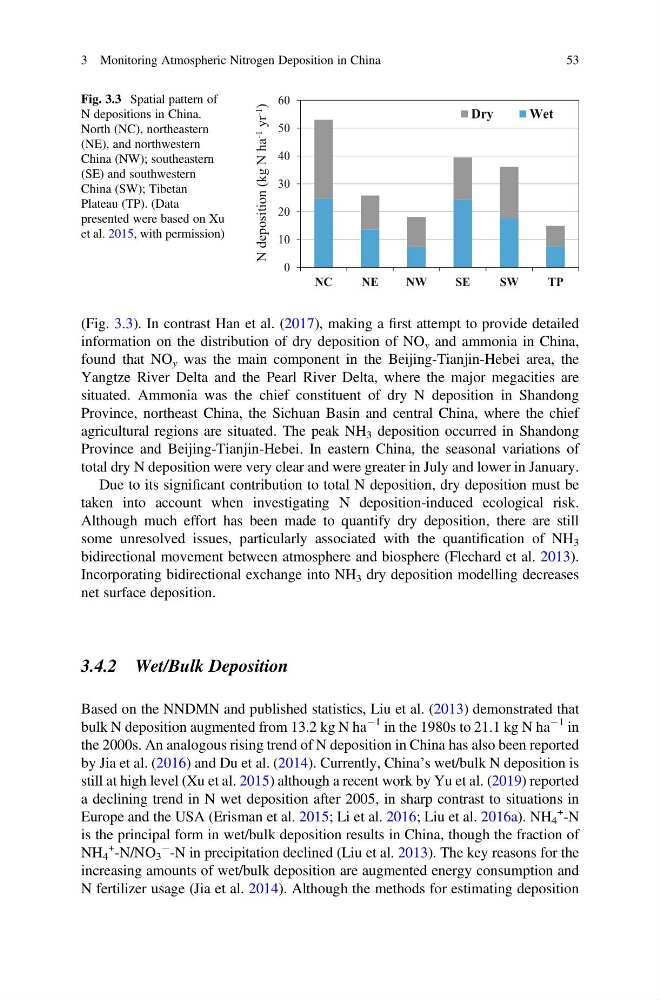
(Fig. 3.3). In contrast Han et al. (2017), making a first attempt to provide detailed
information on the distribution of dry deposition of NO y and ammonia in China,
found that NO y was the main component in the Beijing-Tianjin-Hebei area, the
Yangtze River Delta and the Pearl River Delta, where the major megacities are
situated. Ammonia was the chief constituent of dry N deposition in Shandong
Province, northeast China, the Sichuan Basin and central China, where the chief
agricultural regions are situated. The peak NH 3 deposition occurred in Shandong
Province and Beijing-Tianjin-Hebei. In eastern China, the seasonal variations of
total dry N deposition were very clear and were greater in July and lower in January.
Due to its significant contribution to total N deposition, dry deposition must be
taken into account when investigating N deposition-induced ecological risk.
Although much effort has been made to quantify dry deposition, there are still
some unresolved issues, particularly associated with the quantification of NH 3
bidirectional movement between atmosphere and biosphere (Flechard et al. 2013).
Incorporating bidirectional exchange into NH 3 dry deposition modelling decreases
net surface deposition.
3.4.2 Wet/Bulk Deposition
Based on the NNDMN and published statistics, Liu et al. (2013) demonstrated that
bulk N deposition augmented from 13.2 kg N ha
À1 in the 1980s to 21.1 kg N ha
À1 in
the 2000s. An analogous rising trend of N deposition in China has also been reported
by Jia et al. (2016) and Du et al. (2014). Currently, China’s wet/bulk N deposition is
still at high level (Xu et al. 2015) although a recent work by Yu et al. (2019) reported
a declining trend in N wet deposition after 2005, in sharp contrast to situations in
Europe and the USA (Erisman et al. 2015; Li et al. 2016; Liu et al. 2016a). NH 4
+ -N
is the principal form in wet/bulk deposition results in China, though the fraction of
NH 4
+
-N/NO 3
À -N in precipitation declined (Liu et al. 2013). The key reasons for the
increasing amounts of wet/bulk deposition are augmented energy consumption and
N fertilizer usage (Jia et al. 2014). Although the methods for estimating deposition
0
10
20
30
40
50
60
NC
NE
NW
SE
SW
TP
g
k
(
n
o
i
t
i
s
o
p
e
d
N
N ha -1
yr -1
)
Dry
Wet
Fig. 3.3 Spatial pattern of
N depositions in China.
North (NC), northeastern
(NE), and northwestern
China (NW); southeastern
(SE) and southwestern
China (SW); Tibetan
Plateau (TP). (Data
presented were based on Xu
et al. 2015, with permission)
3 Monitoring Atmospheric Nitrogen Deposition in China
53
information on the distribution of dry deposition of NO y and ammonia in China,
found that NO y was the main component in the Beijing-Tianjin-Hebei area, the
Yangtze River Delta and the Pearl River Delta, where the major megacities are
situated. Ammonia was the chief constituent of dry N deposition in Shandong
Province, northeast China, the Sichuan Basin and central China, where the chief
agricultural regions are situated. The peak NH 3 deposition occurred in Shandong
Province and Beijing-Tianjin-Hebei. In eastern China, the seasonal variations of
total dry N deposition were very clear and were greater in July and lower in January.
Due to its significant contribution to total N deposition, dry deposition must be
taken into account when investigating N deposition-induced ecological risk.
Although much effort has been made to quantify dry deposition, there are still
some unresolved issues, particularly associated with the quantification of NH 3
bidirectional movement between atmosphere and biosphere (Flechard et al. 2013).
Incorporating bidirectional exchange into NH 3 dry deposition modelling decreases
net surface deposition.
3.4.2 Wet/Bulk Deposition
Based on the NNDMN and published statistics, Liu et al. (2013) demonstrated that
bulk N deposition augmented from 13.2 kg N ha
À1 in the 1980s to 21.1 kg N ha
À1 in
the 2000s. An analogous rising trend of N deposition in China has also been reported
by Jia et al. (2016) and Du et al. (2014). Currently, China’s wet/bulk N deposition is
still at high level (Xu et al. 2015) although a recent work by Yu et al. (2019) reported
a declining trend in N wet deposition after 2005, in sharp contrast to situations in
Europe and the USA (Erisman et al. 2015; Li et al. 2016; Liu et al. 2016a). NH 4
+ -N
is the principal form in wet/bulk deposition results in China, though the fraction of
NH 4
+
-N/NO 3
À -N in precipitation declined (Liu et al. 2013). The key reasons for the
increasing amounts of wet/bulk deposition are augmented energy consumption and
N fertilizer usage (Jia et al. 2014). Although the methods for estimating deposition
0
10
20
30
40
50
60
NC
NE
NW
SE
SW
TP
g
k
(
n
o
i
t
i
s
o
p
e
d
N
N ha -1
yr -1
)
Dry
Wet
Fig. 3.3 Spatial pattern of
N depositions in China.
North (NC), northeastern
(NE), and northwestern
China (NW); southeastern
(SE) and southwestern
China (SW); Tibetan
Plateau (TP). (Data
presented were based on Xu
et al. 2015, with permission)
3 Monitoring Atmospheric Nitrogen Deposition in China
53