

Based on a literature review, wet N deposition in coastal regions of China has
been evidenced to increase significantly over the past three decades. For example,
wet N deposition at a WMO/GAW site (Yuen Ng Fan, Hong Kong, close to the
South China Sea) increased from 7.7 kg N ha
À1 year
À1 in 1989 to
10.5 kg N ha
À1 year
À1 in 1992 (Ayers 1996). Wet N deposition at two EANET
sites in Zhuhai (close to Hong Kong) averaged 15.6 kg N ha
À1 year
À1 between 2000
and 2004 (EANET 2006) and was much higher than that in the early 1990s in Hong
Kong (Ayers 1996). At Qianliyan Island (Yellow Sea), wet N deposition increased
from 7.7 kg N ha
À1 year
À1 in 1998 to 12.7 kg N ha
À1 year
À1 in 2005, of which
ammonium deposition remained almost constant but nitrate deposition tripled
(Zhang et al. 2000; Bi 2006). In the Shanghai region, wet deposition was already
as high as 52.5 kg N ha
À1 year
À1 in 1998 and showed no significant change between
1998 and 2003 (Mei and Zhang 2007), indicating that N emissions had reached a
peak due to developed industrial and agricultural activities. In the Xiamen Bay area
in southeast China, monitoring indicated an increase in wet N deposition from 1990
to 2010, which was mainly driven by an increase in nitrate deposition (Chen et al.
2011). More recently, an analysis of N isotopes in a coral core from Dongsha Atoll
indicated a significant increase in N deposition to the open South China Sea from
1968 to 2012 (Ren et al. 2017).
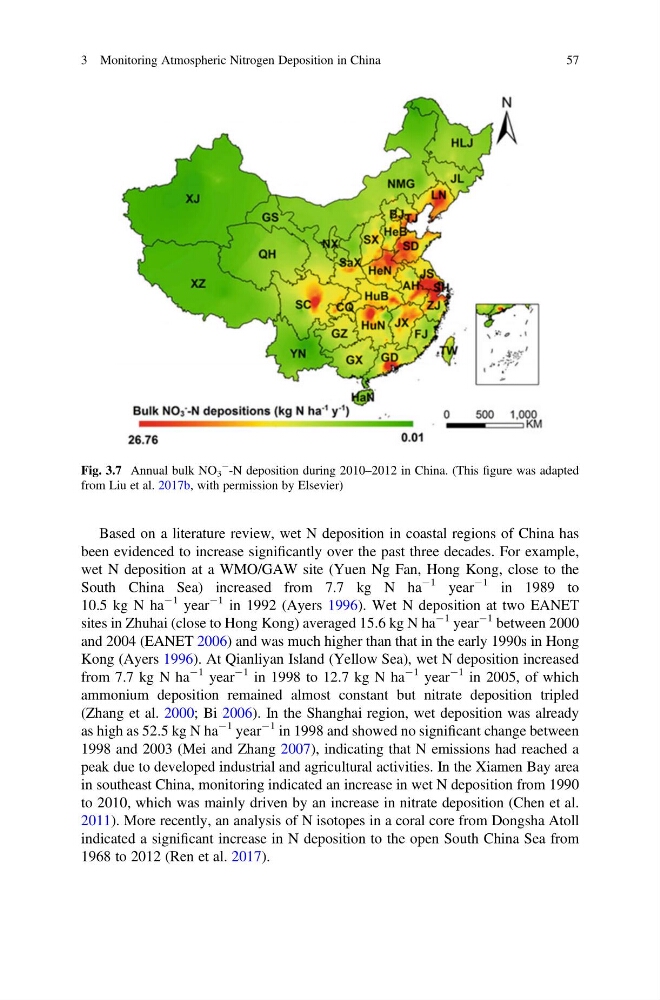
Fig. 3.7 Annual bulk NO 3
À
-N deposition during 2010–2012 in China. (This figure was adapted
from Liu et al. 2017b, with permission by Elsevier)
3 Monitoring Atmospheric Nitrogen Deposition in China
57
been evidenced to increase significantly over the past three decades. For example,
wet N deposition at a WMO/GAW site (Yuen Ng Fan, Hong Kong, close to the
South China Sea) increased from 7.7 kg N ha
À1 year
À1 in 1989 to
10.5 kg N ha
À1 year
À1 in 1992 (Ayers 1996). Wet N deposition at two EANET
sites in Zhuhai (close to Hong Kong) averaged 15.6 kg N ha
À1 year
À1 between 2000
and 2004 (EANET 2006) and was much higher than that in the early 1990s in Hong
Kong (Ayers 1996). At Qianliyan Island (Yellow Sea), wet N deposition increased
from 7.7 kg N ha
À1 year
À1 in 1998 to 12.7 kg N ha
À1 year
À1 in 2005, of which
ammonium deposition remained almost constant but nitrate deposition tripled
(Zhang et al. 2000; Bi 2006). In the Shanghai region, wet deposition was already
as high as 52.5 kg N ha
À1 year
À1 in 1998 and showed no significant change between
1998 and 2003 (Mei and Zhang 2007), indicating that N emissions had reached a
peak due to developed industrial and agricultural activities. In the Xiamen Bay area
in southeast China, monitoring indicated an increase in wet N deposition from 1990
to 2010, which was mainly driven by an increase in nitrate deposition (Chen et al.
2011). More recently, an analysis of N isotopes in a coral core from Dongsha Atoll
indicated a significant increase in N deposition to the open South China Sea from
1968 to 2012 (Ren et al. 2017).
Fig. 3.7 Annual bulk NO 3
À
-N deposition during 2010–2012 in China. (This figure was adapted
from Liu et al. 2017b, with permission by Elsevier)
3 Monitoring Atmospheric Nitrogen Deposition in China
57