

emission reductions were achieved after 2013, and the index decomposition analysis
confirms that emission control measures have been the dominant driver of this
declining emission trend. Pollution controls on the power and industrial sectors are
the most effective measures due to stringent mitigation policies, such as strengthening emission standards, eliminating outdated industrial capacity, and phasing out
small, high-emitting factories.
Due to marked increasing demand for meat and crop yields, NH 3 emissions in
China nearly doubled over the last three decades. The national annual NH 3 emissions remain constant at approximately 10.0 Tg over recent years, with agricultural
activities contributing more than 80%. Agricultural production practices, including
fertilizer application (fertilizer types, amounts, application methods, fertilization
timing) and animal manure management, determine the magnitude and variation in
NH 3 emissions.
From the viewpoint of policy-making, the change in the sectoral distribution of
emissions indicates that it is paramount to shift policy focus to enable further
emission reductions. The residential sector is estimated to account for 23% of
emitted SO 2 in 2017, comparable to or even larger than the emissions from the
power and industrial sectors. The contribution of off-road transport to NO x emissions
is estimated to have increased from 8% to 12% and thus ranked as the fourth largest
single sector in 2017. The less-controlled emission sources including residential and
off-road transportation sources have large potential effects on China’s 2020 air
quality target; thus, China needs to increase its focus on these sources in the future.
2008 2009 2010 2011 2012 2013 2014 2015 2016
5
10
15
20
25
30
35
IASI obs.
Simulated NH 3 VCDs
NH 3 VCDs using 2008 SO 2 emissions
VCDs
㸦10
15
m
c
s
e
l
u
c
e
l
o
m
-2
)
Year
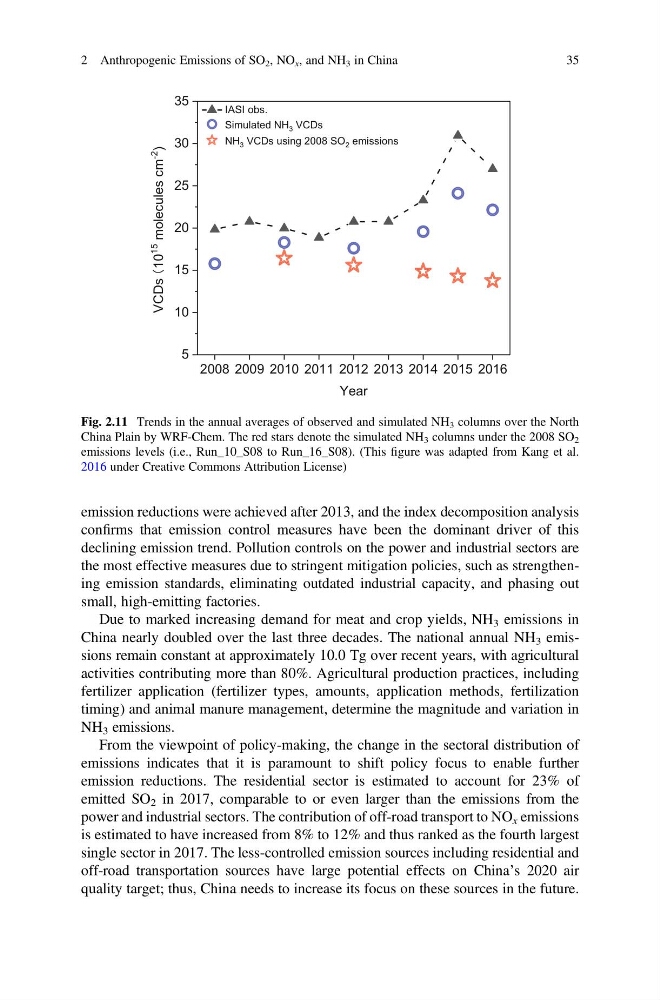
Fig. 2.11 Trends in the annual averages of observed and simulated NH 3 columns over the North
China Plain by WRF-Chem. The red stars denote the simulated NH 3 columns under the 2008 SO 2
emissions levels (i.e., Run_10_S08 to Run_16_S08). (This figure was adapted from Kang et al.
2016 under Creative Commons Attribution License)
2 Anthropogenic Emissions of SO 2 , NO x , and NH 3 in China
35
confirms that emission control measures have been the dominant driver of this
declining emission trend. Pollution controls on the power and industrial sectors are
the most effective measures due to stringent mitigation policies, such as strengthening emission standards, eliminating outdated industrial capacity, and phasing out
small, high-emitting factories.
Due to marked increasing demand for meat and crop yields, NH 3 emissions in
China nearly doubled over the last three decades. The national annual NH 3 emissions remain constant at approximately 10.0 Tg over recent years, with agricultural
activities contributing more than 80%. Agricultural production practices, including
fertilizer application (fertilizer types, amounts, application methods, fertilization
timing) and animal manure management, determine the magnitude and variation in
NH 3 emissions.
From the viewpoint of policy-making, the change in the sectoral distribution of
emissions indicates that it is paramount to shift policy focus to enable further
emission reductions. The residential sector is estimated to account for 23% of
emitted SO 2 in 2017, comparable to or even larger than the emissions from the
power and industrial sectors. The contribution of off-road transport to NO x emissions
is estimated to have increased from 8% to 12% and thus ranked as the fourth largest
single sector in 2017. The less-controlled emission sources including residential and
off-road transportation sources have large potential effects on China’s 2020 air
quality target; thus, China needs to increase its focus on these sources in the future.
2008 2009 2010 2011 2012 2013 2014 2015 2016
5
10
15
20
25
30
35
IASI obs.
Simulated NH 3 VCDs
NH 3 VCDs using 2008 SO 2 emissions
VCDs
㸦10
15
m
c
s
e
l
u
c
e
l
o
m
-2
)
Year
Fig. 2.11 Trends in the annual averages of observed and simulated NH 3 columns over the North
China Plain by WRF-Chem. The red stars denote the simulated NH 3 columns under the 2008 SO 2
emissions levels (i.e., Run_10_S08 to Run_16_S08). (This figure was adapted from Kang et al.
2016 under Creative Commons Attribution License)
2 Anthropogenic Emissions of SO 2 , NO x , and NH 3 in China
35