

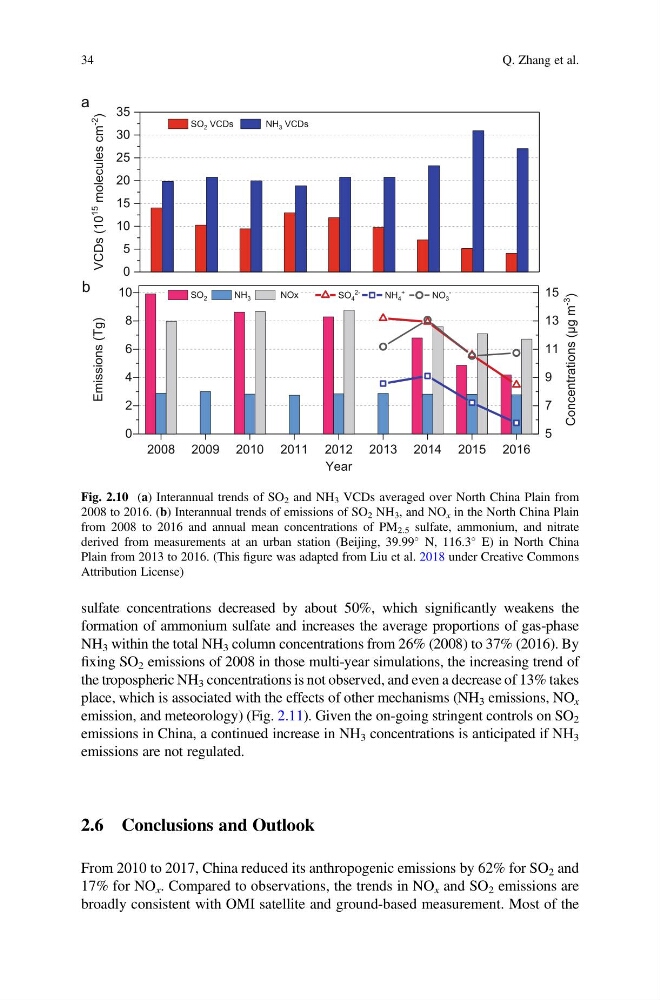
sulfate concentrations decreased by about 50%, which significantly weakens the
formation of ammonium sulfate and increases the average proportions of gas-phase
NH 3 within the total NH 3 column concentrations from 26% (2008) to 37% (2016). By
fixing SO 2 emissions of 2008 in those multi-year simulations, the increasing trend of
the tropospheric NH 3 concentrations is not observed, and even a decrease of 13% takes
place, which is associated with the effects of other mechanisms (NH 3 emissions, NO x
emission, and meteorology) (Fig. 2.11). Given the on-going stringent controls on SO 2
emissions in China, a continued increase in NH 3 concentrations is anticipated if NH 3
emissions are not regulated.
2.6 Conclusions and Outlook
From 2010 to 2017, China reduced its anthropogenic emissions by 62% for SO 2 and
17% for NO x . Compared to observations, the trends in NO x and SO 2 emissions are
broadly consistent with OMI satellite and ground-based measurement. Most of the
SO 2 VCDs
NH 3 VCDs
2008 2009 2010 2011 2012 2013 2014 2015 2016
0
2
4
6
8
10
0
5
10
15
20
25
30
35
0
1
(
s
D
C
V
15
m
c
s
e
l
u
c
e
l
o
m
-2
)
SO 2
NH 3
NOx
)
g
T
(
s
n
o
i
s
s
i
m
E
Year
a
b
5
7
9
11
13
15
SO 4
2NH 4
+
NO 3
-
Concentrations (μg m
-3
)
Fig. 2.10 (a) Interannual trends of SO 2 and NH 3 VCDs averaged over North China Plain from
2008 to 2016. (b) Interannual trends of emissions of SO 2 NH 3 , and NO x in the North China Plain
from 2008 to 2016 and annual mean concentrations of PM 2.5 sulfate, ammonium, and nitrate
derived from measurements at an urban station (Beijing, 39.99
N, 116.3
E) in North China
Plain from 2013 to 2016. (This figure was adapted from Liu et al. 2018 under Creative Commons
Attribution License)
34
Q. Zhang et al.
formation of ammonium sulfate and increases the average proportions of gas-phase
NH 3 within the total NH 3 column concentrations from 26% (2008) to 37% (2016). By
fixing SO 2 emissions of 2008 in those multi-year simulations, the increasing trend of
the tropospheric NH 3 concentrations is not observed, and even a decrease of 13% takes
place, which is associated with the effects of other mechanisms (NH 3 emissions, NO x
emission, and meteorology) (Fig. 2.11). Given the on-going stringent controls on SO 2
emissions in China, a continued increase in NH 3 concentrations is anticipated if NH 3
emissions are not regulated.
2.6 Conclusions and Outlook
From 2010 to 2017, China reduced its anthropogenic emissions by 62% for SO 2 and
17% for NO x . Compared to observations, the trends in NO x and SO 2 emissions are
broadly consistent with OMI satellite and ground-based measurement. Most of the
SO 2 VCDs
NH 3 VCDs
2008 2009 2010 2011 2012 2013 2014 2015 2016
0
2
4
6
8
10
0
5
10
15
20
25
30
35
0
1
(
s
D
C
V
15
m
c
s
e
l
u
c
e
l
o
m
-2
)
SO 2
NH 3
NOx
)
g
T
(
s
n
o
i
s
s
i
m
E
Year
a
b
5
7
9
11
13
15
SO 4
2NH 4
+
NO 3
-
Concentrations (μg m
-3
)
Fig. 2.10 (a) Interannual trends of SO 2 and NH 3 VCDs averaged over North China Plain from
2008 to 2016. (b) Interannual trends of emissions of SO 2 NH 3 , and NO x in the North China Plain
from 2008 to 2016 and annual mean concentrations of PM 2.5 sulfate, ammonium, and nitrate
derived from measurements at an urban station (Beijing, 39.99
N, 116.3
E) in North China
Plain from 2013 to 2016. (This figure was adapted from Liu et al. 2018 under Creative Commons
Attribution License)
34
Q. Zhang et al.