

approximately 9 Tg during the same period, due to the installation of FGD systems,
the construction of large units, and the decommissioning of small units; these steps
were taken to achieve the planned 10% reduction in emissions during the 11th FYP
period (Liu et al. 2015). On the other hand, control measures were still lacking in
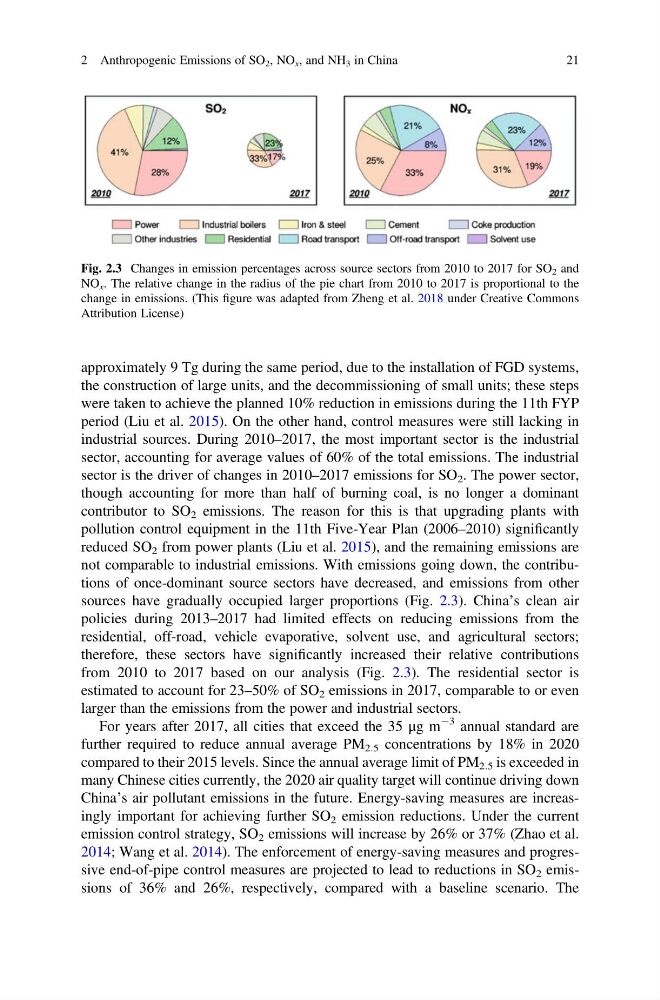
industrial sources. During 2010–2017, the most important sector is the industrial
sector, accounting for average values of 60% of the total emissions. The industrial
sector is the driver of changes in 2010–2017 emissions for SO 2 . The power sector,
though accounting for more than half of burning coal, is no longer a dominant
contributor to SO 2 emissions. The reason for this is that upgrading plants with
pollution control equipment in the 11th Five-Year Plan (2006–2010) significantly
reduced SO 2 from power plants (Liu et al. 2015), and the remaining emissions are
not comparable to industrial emissions. With emissions going down, the contributions of once-dominant source sectors have decreased, and emissions from other
sources have gradually occupied larger proportions (Fig. 2.3). China’s clean air
policies during 2013–2017 had limited effects on reducing emissions from the
residential, off-road, vehicle evaporative, solvent use, and agricultural sectors;
therefore, these sectors have significantly increased their relative contributions
from 2010 to 2017 based on our analysis (Fig. 2.3). The residential sector is
estimated to account for 23–50% of SO 2 emissions in 2017, comparable to or even
larger than the emissions from the power and industrial sectors.
For years after 2017, all cities that exceed the 35 μg m
À3 annual standard are
further required to reduce annual average PM 2.5 concentrations by 18% in 2020
compared to their 2015 levels. Since the annual average limit of PM 2.5 is exceeded in
many Chinese cities currently, the 2020 air quality target will continue driving down
China’s air pollutant emissions in the future. Energy-saving measures are increasingly important for achieving further SO 2 emission reductions. Under the current
emission control strategy, SO 2 emissions will increase by 26% or 37% (Zhao et al.
2014; Wang et al. 2014). The enforcement of energy-saving measures and progressive end-of-pipe control measures are projected to lead to reductions in SO 2 emissions of 36% and 26%, respectively, compared with a baseline scenario. The
Fig. 2.3 Changes in emission percentages across source sectors from 2010 to 2017 for SO 2 and
NO x . The relative change in the radius of the pie chart from 2010 to 2017 is proportional to the
change in emissions. (This figure was adapted from Zheng et al. 2018 under Creative Commons
Attribution License)
2 Anthropogenic Emissions of SO 2 , NO x , and NH 3 in China
21
the construction of large units, and the decommissioning of small units; these steps
were taken to achieve the planned 10% reduction in emissions during the 11th FYP
period (Liu et al. 2015). On the other hand, control measures were still lacking in
industrial sources. During 2010–2017, the most important sector is the industrial
sector, accounting for average values of 60% of the total emissions. The industrial
sector is the driver of changes in 2010–2017 emissions for SO 2 . The power sector,
though accounting for more than half of burning coal, is no longer a dominant
contributor to SO 2 emissions. The reason for this is that upgrading plants with
pollution control equipment in the 11th Five-Year Plan (2006–2010) significantly
reduced SO 2 from power plants (Liu et al. 2015), and the remaining emissions are
not comparable to industrial emissions. With emissions going down, the contributions of once-dominant source sectors have decreased, and emissions from other
sources have gradually occupied larger proportions (Fig. 2.3). China’s clean air
policies during 2013–2017 had limited effects on reducing emissions from the
residential, off-road, vehicle evaporative, solvent use, and agricultural sectors;
therefore, these sectors have significantly increased their relative contributions
from 2010 to 2017 based on our analysis (Fig. 2.3). The residential sector is
estimated to account for 23–50% of SO 2 emissions in 2017, comparable to or even
larger than the emissions from the power and industrial sectors.
For years after 2017, all cities that exceed the 35 μg m
À3 annual standard are
further required to reduce annual average PM 2.5 concentrations by 18% in 2020
compared to their 2015 levels. Since the annual average limit of PM 2.5 is exceeded in
many Chinese cities currently, the 2020 air quality target will continue driving down
China’s air pollutant emissions in the future. Energy-saving measures are increasingly important for achieving further SO 2 emission reductions. Under the current
emission control strategy, SO 2 emissions will increase by 26% or 37% (Zhao et al.
2014; Wang et al. 2014). The enforcement of energy-saving measures and progressive end-of-pipe control measures are projected to lead to reductions in SO 2 emissions of 36% and 26%, respectively, compared with a baseline scenario. The
Fig. 2.3 Changes in emission percentages across source sectors from 2010 to 2017 for SO 2 and
NO x . The relative change in the radius of the pie chart from 2010 to 2017 is proportional to the
change in emissions. (This figure was adapted from Zheng et al. 2018 under Creative Commons
Attribution License)
2 Anthropogenic Emissions of SO 2 , NO x , and NH 3 in China
21