

1. SO 2 emissions. SO 2 emissions in China are estimated to have been 18–28 Tg,
29–35 Tg, 24–31 Tg, and 22–26 Tg in 2000, 2005, 2010, and 2014, respectively
(derived from literature cited in Fig. 2.1). From 2000 to 2006, SO 2 emissions in
China increased by 53–65% at an annual growth rate of 7.3–8.7% (Lu et al. 2011;
Kurokawa et al. 2013; Xia et al. 2016, EDGAR v4.2 (available at http://edgar.jrc.
ec.europa.eu/), MEIC v1.2 (available at www.meicmodel.org)). The growth of
emissions began to slow in approximately 2005; emissions then decreased after
2006, due to the nationwide use of FGD (Flue-gas desulfurization) systems in
power plants (Lu et al. 2011; Xu 2011). The annual growth rate of SO 2 emissions
for the period of 2006–2010 was À4.6%, according to the MEIC dataset; this
value reflects the efficacy of the control measures implemented during the 11th
Five-Year Plan (FYP). During the 12th FYP, the 8% emission reduction target
was achieved (a 14% reduction was realized, according to MEIC).
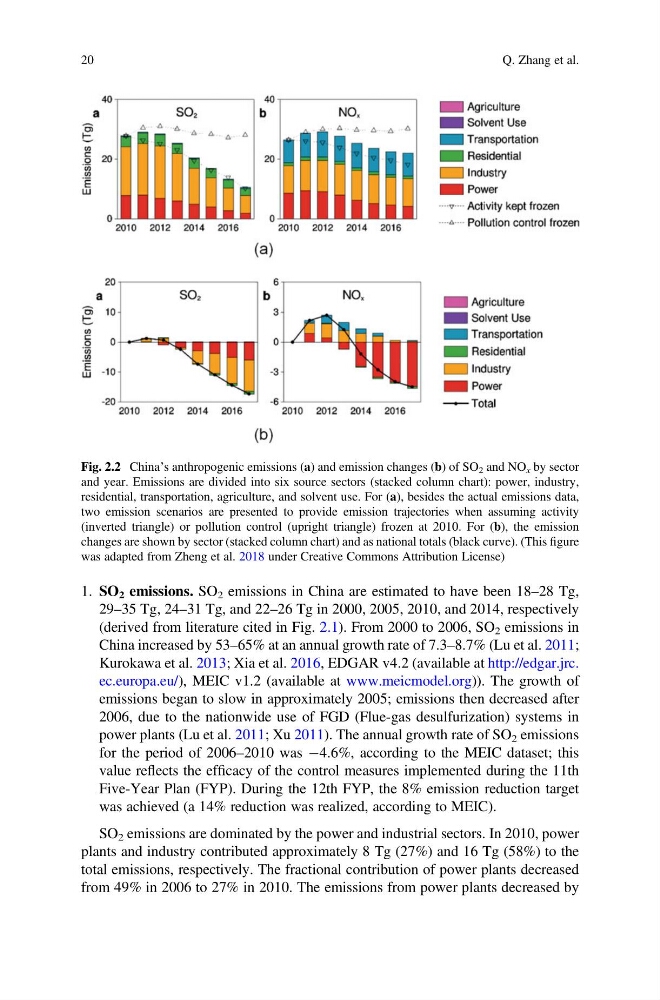
SO 2 emissions are dominated by the power and industrial sectors. In 2010, power
plants and industry contributed approximately 8 Tg (27%) and 16 Tg (58%) to the
total emissions, respectively. The fractional contribution of power plants decreased
from 49% in 2006 to 27% in 2010. The emissions from power plants decreased by
Fig. 2.2 China’s anthropogenic emissions (a) and emission changes (b) of SO 2 and NO x by sector
and year. Emissions are divided into six source sectors (stacked column chart): power, industry,
residential, transportation, agriculture, and solvent use. For (a), besides the actual emissions data,
two emission scenarios are presented to provide emission trajectories when assuming activity
(inverted triangle) or pollution control (upright triangle) frozen at 2010. For (b), the emission
changes are shown by sector (stacked column chart) and as national totals (black curve). (This figure
was adapted from Zheng et al. 2018 under Creative Commons Attribution License)
20
Q. Zhang et al.
29–35 Tg, 24–31 Tg, and 22–26 Tg in 2000, 2005, 2010, and 2014, respectively
(derived from literature cited in Fig. 2.1). From 2000 to 2006, SO 2 emissions in
China increased by 53–65% at an annual growth rate of 7.3–8.7% (Lu et al. 2011;
Kurokawa et al. 2013; Xia et al. 2016, EDGAR v4.2 (available at http://edgar.jrc.
ec.europa.eu/), MEIC v1.2 (available at www.meicmodel.org)). The growth of
emissions began to slow in approximately 2005; emissions then decreased after
2006, due to the nationwide use of FGD (Flue-gas desulfurization) systems in
power plants (Lu et al. 2011; Xu 2011). The annual growth rate of SO 2 emissions
for the period of 2006–2010 was À4.6%, according to the MEIC dataset; this
value reflects the efficacy of the control measures implemented during the 11th
Five-Year Plan (FYP). During the 12th FYP, the 8% emission reduction target
was achieved (a 14% reduction was realized, according to MEIC).
SO 2 emissions are dominated by the power and industrial sectors. In 2010, power
plants and industry contributed approximately 8 Tg (27%) and 16 Tg (58%) to the
total emissions, respectively. The fractional contribution of power plants decreased
from 49% in 2006 to 27% in 2010. The emissions from power plants decreased by
Fig. 2.2 China’s anthropogenic emissions (a) and emission changes (b) of SO 2 and NO x by sector
and year. Emissions are divided into six source sectors (stacked column chart): power, industry,
residential, transportation, agriculture, and solvent use. For (a), besides the actual emissions data,
two emission scenarios are presented to provide emission trajectories when assuming activity
(inverted triangle) or pollution control (upright triangle) frozen at 2010. For (b), the emission
changes are shown by sector (stacked column chart) and as national totals (black curve). (This figure
was adapted from Zheng et al. 2018 under Creative Commons Attribution License)
20
Q. Zhang et al.