

emission factors of particles and SO 2 are found for new precalciner kilns with
advanced APCD. However, an increased NO X emission factor is estimated if no
additional control like SNCR technology is applied. The more automated air-flow
systems and higher operational temperatures of precalciner kilns elevate NO X
emissions compared to shaft kilns. Combining the changes in fleet mix of kiln
types and the emission factors by Lei et al. (2011b), the sector average of SO 2
emission factor (expressed as pollutants per unit of cement production) is estimated
to have declined by 54%, during 2000–2014, while that for NO X increased by 73%
in the PRI case, as illustrated in Fig. 14.1b. In the updated emission standard for
cement sector (GB 4915-2013), NO X concentration in flue gas is required to
decrease from 800 to 400 mg/m
3 , reducing the average emission factor to 1.2 kg
NO X /t-clinker. By assuming that production of 1 ton of cement requires 125 kg of
coal in precalciner kilns and that 1 ton of cement is produced from 0.72 tons of
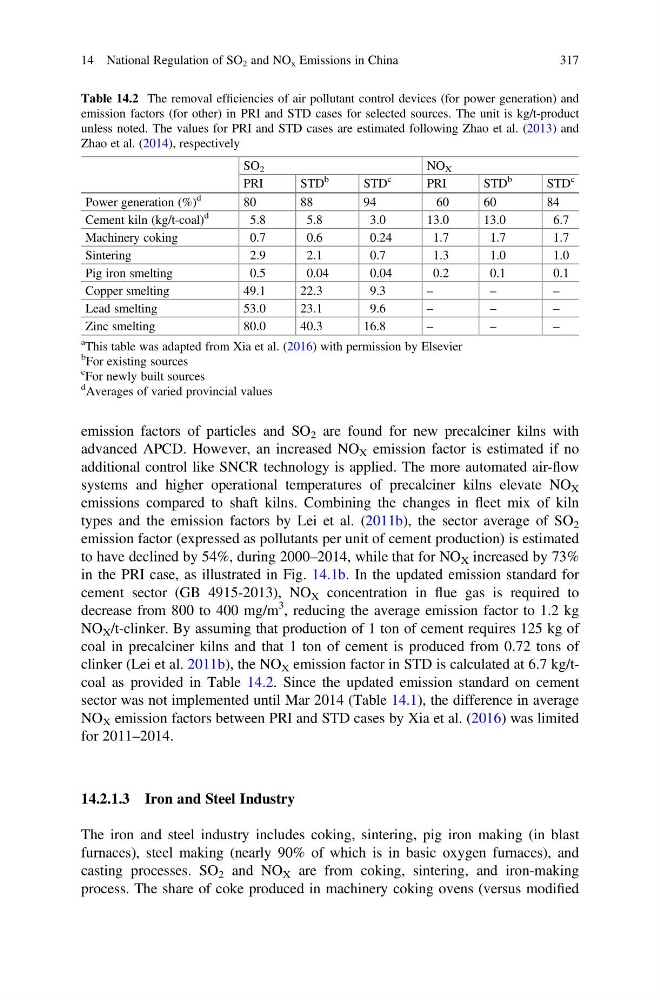
clinker (Lei et al. 2011b), the NO X emission factor in STD is calculated at 6.7 kg/tcoal as provided in Table 14.2. Since the updated emission standard on cement
sector was not implemented until Mar 2014 (Table 14.1), the difference in average
NO X emission factors between PRI and STD cases by Xia et al. (2016) was limited
for 2011–2014.
14.2.1.3 Iron and Steel Industry
The iron and steel industry includes coking, sintering, pig iron making (in blast
furnaces), steel making (nearly 90% of which is in basic oxygen furnaces), and
casting processes. SO 2 and NO X are from coking, sintering, and iron-making
process. The share of coke produced in machinery coking ovens (versus modified
Table 14.2 The removal efficiencies of air pollutant control devices (for power generation) and
emission factors (for other) in PRI and STD cases for selected sources. The unit is kg/t-product
unless noted. The values for PRI and STD cases are estimated following Zhao et al. (2013) and
Zhao et al. (2014), respectively
SO 2
NO X
PRI
STD
b
STD
c
PRI
STD
b
STD
c
Power generation (%)
d
80
88
94
60
60
84
Cement kiln (kg/t-coal)
d
5.8
5.8
3.0
13.0
13.0
6.7
Machinery coking
0.7
0.6
0.24
1.7
1.7
1.7
Sintering
2.9
2.1
0.7
1.3
1.0
1.0
Pig iron smelting
0.5
0.04
0.04
0.2
0.1
0.1
Copper smelting
49.1
22.3
9.3
–
–
–
Lead smelting
53.0
23.1
9.6
–
–
–
Zinc smelting
80.0
40.3
16.8
–
–
–
a This table was adapted from Xia et al. (2016) with permission by Elsevier
b
For existing sources
c For newly built sources
d
Averages of varied provincial values
14 National Regulation of SO 2 and NO x Emissions in China
317
advanced APCD. However, an increased NO X emission factor is estimated if no
additional control like SNCR technology is applied. The more automated air-flow
systems and higher operational temperatures of precalciner kilns elevate NO X
emissions compared to shaft kilns. Combining the changes in fleet mix of kiln
types and the emission factors by Lei et al. (2011b), the sector average of SO 2
emission factor (expressed as pollutants per unit of cement production) is estimated
to have declined by 54%, during 2000–2014, while that for NO X increased by 73%
in the PRI case, as illustrated in Fig. 14.1b. In the updated emission standard for
cement sector (GB 4915-2013), NO X concentration in flue gas is required to
decrease from 800 to 400 mg/m
3 , reducing the average emission factor to 1.2 kg
NO X /t-clinker. By assuming that production of 1 ton of cement requires 125 kg of
coal in precalciner kilns and that 1 ton of cement is produced from 0.72 tons of
clinker (Lei et al. 2011b), the NO X emission factor in STD is calculated at 6.7 kg/tcoal as provided in Table 14.2. Since the updated emission standard on cement
sector was not implemented until Mar 2014 (Table 14.1), the difference in average
NO X emission factors between PRI and STD cases by Xia et al. (2016) was limited
for 2011–2014.
14.2.1.3 Iron and Steel Industry
The iron and steel industry includes coking, sintering, pig iron making (in blast
furnaces), steel making (nearly 90% of which is in basic oxygen furnaces), and
casting processes. SO 2 and NO X are from coking, sintering, and iron-making
process. The share of coke produced in machinery coking ovens (versus modified
Table 14.2 The removal efficiencies of air pollutant control devices (for power generation) and
emission factors (for other) in PRI and STD cases for selected sources. The unit is kg/t-product
unless noted. The values for PRI and STD cases are estimated following Zhao et al. (2013) and
Zhao et al. (2014), respectively
SO 2
NO X
PRI
STD
b
STD
c
PRI
STD
b
STD
c
Power generation (%)
d
80
88
94
60
60
84
Cement kiln (kg/t-coal)
d
5.8
5.8
3.0
13.0
13.0
6.7
Machinery coking
0.7
0.6
0.24
1.7
1.7
1.7
Sintering
2.9
2.1
0.7
1.3
1.0
1.0
Pig iron smelting
0.5
0.04
0.04
0.2
0.1
0.1
Copper smelting
49.1
22.3
9.3
–
–
–
Lead smelting
53.0
23.1
9.6
–
–
–
Zinc smelting
80.0
40.3
16.8
–
–
–
a This table was adapted from Xia et al. (2016) with permission by Elsevier
b
For existing sources
c For newly built sources
d
Averages of varied provincial values
14 National Regulation of SO 2 and NO x Emissions in China
317