

0%
20%
40%
60%
80%
100%
2000 2001 2002 2003 2004 2005 2006 2007 2008 2009 2010 2011 2012 2013 2014
n
o
i
t
a
r
t
e
n
e
p
y
g
o
l
o
n
h
c
e
T
1
0%
20%
40%
60%
80%
100%
120%
EF relative to 2000 level1
>=300 MW
<300 MW
(a)
0%
20%
40%
60%
80%
100%
2000 2001 2002 2003 2004 2005 2006 2007 2008 2009 2010 2011 2012 2013 2014
n
o
i
t
a
r
t
e
n
e
p
y
g
o
l
o
n
h
c
e
T
1
0%
20%
40%
60%
80%
100%
120%
140%
160%
180%
200%
EF relative to 2000 level1
Precalciner kilns
Other kilns
(b)
0%
20%
40%
60%
80%
100%
2000 2001 2002 2003 2004 2005 2006 2007 2008 2009 2010 2011 2012 2013 2014
1
n
o
i
t
a
r
t
e
n
e
p
y
g
o
l
o
n
h
c
e
T
0%
20%
40%
60%
80%
100%
120%
EF relative to 2000 level1
Mechanized coking oven Indigenous coking oven
(c)
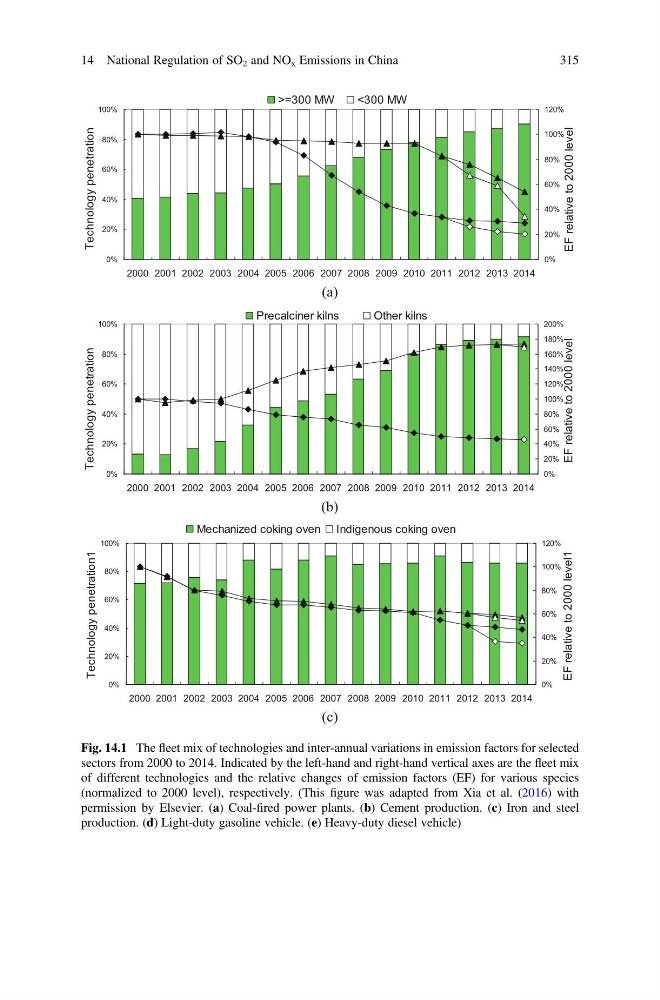
Fig. 14.1 The fleet mix of technologies and inter-annual variations in emission factors for selected
sectors from 2000 to 2014. Indicated by the left-hand and right-hand vertical axes are the fleet mix
of different technologies and the relative changes of emission factors (EF) for various species
(normalized to 2000 level), respectively. (This figure was adapted from Xia et al. (2016) with
permission by Elsevier. (a) Coal-fired power plants. (b) Cement production. (c) Iron and steel
production. (d) Light-duty gasoline vehicle. (e) Heavy-duty diesel vehicle)
14 National Regulation of SO 2 and NO x Emissions in China
315
20%
40%
60%
80%
100%
2000 2001 2002 2003 2004 2005 2006 2007 2008 2009 2010 2011 2012 2013 2014
n
o
i
t
a
r
t
e
n
e
p
y
g
o
l
o
n
h
c
e
T
1
0%
20%
40%
60%
80%
100%
120%
EF relative to 2000 level1
>=300 MW
<300 MW
(a)
0%
20%
40%
60%
80%
100%
2000 2001 2002 2003 2004 2005 2006 2007 2008 2009 2010 2011 2012 2013 2014
n
o
i
t
a
r
t
e
n
e
p
y
g
o
l
o
n
h
c
e
T
1
0%
20%
40%
60%
80%
100%
120%
140%
160%
180%
200%
EF relative to 2000 level1
Precalciner kilns
Other kilns
(b)
0%
20%
40%
60%
80%
100%
2000 2001 2002 2003 2004 2005 2006 2007 2008 2009 2010 2011 2012 2013 2014
1
n
o
i
t
a
r
t
e
n
e
p
y
g
o
l
o
n
h
c
e
T
0%
20%
40%
60%
80%
100%
120%
EF relative to 2000 level1
Mechanized coking oven Indigenous coking oven
(c)
Fig. 14.1 The fleet mix of technologies and inter-annual variations in emission factors for selected
sectors from 2000 to 2014. Indicated by the left-hand and right-hand vertical axes are the fleet mix
of different technologies and the relative changes of emission factors (EF) for various species
(normalized to 2000 level), respectively. (This figure was adapted from Xia et al. (2016) with
permission by Elsevier. (a) Coal-fired power plants. (b) Cement production. (c) Iron and steel
production. (d) Light-duty gasoline vehicle. (e) Heavy-duty diesel vehicle)
14 National Regulation of SO 2 and NO x Emissions in China
315