

converted, where riverine N inputs were estimated by using Eq. (12.7). N form and
dry deposition fluxes were simply assumed equivalent in level in the period
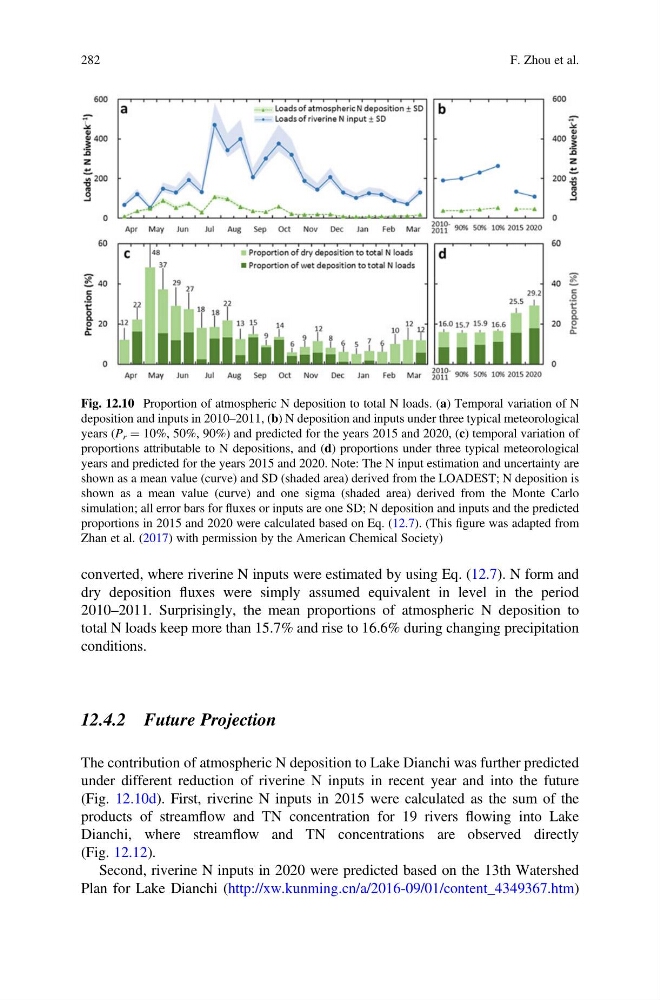
2010–2011. Surprisingly, the mean proportions of atmospheric N deposition to
total N loads keep more than 15.7% and rise to 16.6% during changing precipitation
conditions.
12.4.2 Future Projection
The contribution of atmospheric N deposition to Lake Dianchi was further predicted
under different reduction of riverine N inputs in recent year and into the future
(Fig. 12.10d). First, riverine N inputs in 2015 were calculated as the sum of the
products of streamflow and TN concentration for 19 rivers flowing into Lake
Dianchi, where streamflow and TN concentrations are observed directly
(Fig. 12.12).
Second, riverine N inputs in 2020 were predicted based on the 13th Watershed
Plan for Lake Dianchi (http://xw.kunming.cn/a/2016-09/01/content_4349367.htm)
Fig. 12.10 Proportion of atmospheric N deposition to total N loads. (a) Temporal variation of N
deposition and inputs in 2010–2011, (b) N deposition and inputs under three typical meteorological
years (P r ¼ 10%, 50%, 90%) and predicted for the years 2015 and 2020, (c) temporal variation of
proportions attributable to N depositions, and (d) proportions under three typical meteorological
years and predicted for the years 2015 and 2020. Note: The N input estimation and uncertainty are
shown as a mean value (curve) and SD (shaded area) derived from the LOADEST; N deposition is
shown as a mean value (curve) and one sigma (shaded area) derived from the Monte Carlo
simulation; all error bars for fluxes or inputs are one SD; N deposition and inputs and the predicted
proportions in 2015 and 2020 were calculated based on Eq. (12.7). (This figure was adapted from
Zhan et al. (2017) with permission by the American Chemical Society)
282
F. Zhou et al.
dry deposition fluxes were simply assumed equivalent in level in the period
2010–2011. Surprisingly, the mean proportions of atmospheric N deposition to
total N loads keep more than 15.7% and rise to 16.6% during changing precipitation
conditions.
12.4.2 Future Projection
The contribution of atmospheric N deposition to Lake Dianchi was further predicted
under different reduction of riverine N inputs in recent year and into the future
(Fig. 12.10d). First, riverine N inputs in 2015 were calculated as the sum of the
products of streamflow and TN concentration for 19 rivers flowing into Lake
Dianchi, where streamflow and TN concentrations are observed directly
(Fig. 12.12).
Second, riverine N inputs in 2020 were predicted based on the 13th Watershed
Plan for Lake Dianchi (http://xw.kunming.cn/a/2016-09/01/content_4349367.htm)
Fig. 12.10 Proportion of atmospheric N deposition to total N loads. (a) Temporal variation of N
deposition and inputs in 2010–2011, (b) N deposition and inputs under three typical meteorological
years (P r ¼ 10%, 50%, 90%) and predicted for the years 2015 and 2020, (c) temporal variation of
proportions attributable to N depositions, and (d) proportions under three typical meteorological
years and predicted for the years 2015 and 2020. Note: The N input estimation and uncertainty are
shown as a mean value (curve) and SD (shaded area) derived from the LOADEST; N deposition is
shown as a mean value (curve) and one sigma (shaded area) derived from the Monte Carlo
simulation; all error bars for fluxes or inputs are one SD; N deposition and inputs and the predicted
proportions in 2015 and 2020 were calculated based on Eq. (12.7). (This figure was adapted from
Zhan et al. (2017) with permission by the American Chemical Society)
282
F. Zhou et al.