

that indicated the riverine N inputs will decrease to 89% compared to 2015 inputs.
Third, for each precipitation scenario in 2015 and 2020, the ratio of atmospheric N
deposition to total N loads into the Lake Dianchi, defined as η p , was predicted under
different reduction ratios (r) related to riverine N inputs in 2010–2011 as follows:
η p ¼
N
dry
p þ N
wet
p
N
dry
p þ N
wet
p þ N
river
p
1 À r
ð
Þ
ð12:7Þ
where p is the percentiles of the Pearson type III distribution and confidence interval
percentiles of for precipitation (10%, 50%, or 90%) and N p
dry , N p
wet , and N p
river are
defined as dry deposition of N, wet deposition of N, and riverine N inputs under
different precipitation scenario, respectively. Here, we assume that there will be no
substantial improvement of air quality in the near future and that both river discharges (Q) and fluxes of wet deposition increase linearly with the increasing
precipitation. N p
dry , N p
wet , and N p
river were then estimated by
N
dry
p ¼ N
dry
2010À2011
ð12:8aÞ
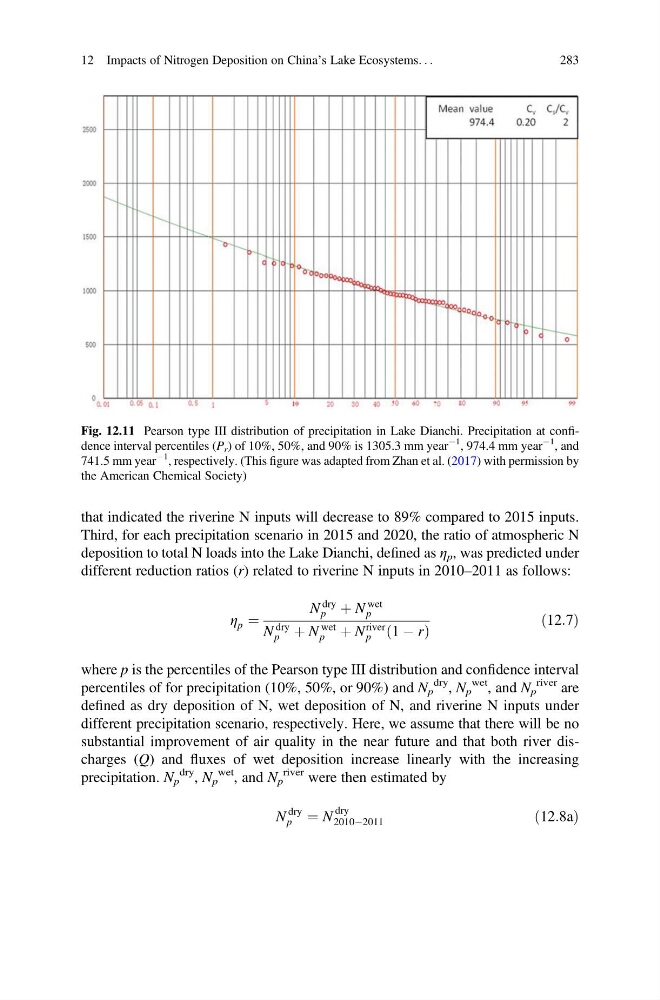
Fig. 12.11 Pearson type III distribution of precipitation in Lake Dianchi. Precipitation at confidence interval percentiles (P r ) of 10%, 50%, and 90% is 1305.3 mm year
À1
, 974.4 mm year
À1
, and
741.5 mm year
À1
, respectively. (This figure was adapted from Zhan et al. (2017) with permission by
the American Chemical Society)
12 Impacts of Nitrogen Deposition on China’s Lake Ecosystems. . .
283
Third, for each precipitation scenario in 2015 and 2020, the ratio of atmospheric N
deposition to total N loads into the Lake Dianchi, defined as η p , was predicted under
different reduction ratios (r) related to riverine N inputs in 2010–2011 as follows:
η p ¼
N
dry
p þ N
wet
p
N
dry
p þ N
wet
p þ N
river
p
1 À r
ð
Þ
ð12:7Þ
where p is the percentiles of the Pearson type III distribution and confidence interval
percentiles of for precipitation (10%, 50%, or 90%) and N p
dry , N p
wet , and N p
river are
defined as dry deposition of N, wet deposition of N, and riverine N inputs under
different precipitation scenario, respectively. Here, we assume that there will be no
substantial improvement of air quality in the near future and that both river discharges (Q) and fluxes of wet deposition increase linearly with the increasing
precipitation. N p
dry , N p
wet , and N p
river were then estimated by
N
dry
p ¼ N
dry
2010À2011
ð12:8aÞ
Fig. 12.11 Pearson type III distribution of precipitation in Lake Dianchi. Precipitation at confidence interval percentiles (P r ) of 10%, 50%, and 90% is 1305.3 mm year
À1
, 974.4 mm year
À1
, and
741.5 mm year
À1
, respectively. (This figure was adapted from Zhan et al. (2017) with permission by
the American Chemical Society)
12 Impacts of Nitrogen Deposition on China’s Lake Ecosystems. . .
283