

velocities (assuming CV ¼ 10%), sampling processes (assuming CV ¼ 5%), and
riverine N inputs was determined by a Monte Carlo ensemble simulation (Zhou et al.
2014). More importantly, the contribution made by atmospheric N deposition
increased to 27 Æ 5~48 Æ 8% of total N loads in later spring and early summer
(Fig. 12.10c), when phytoplankton is experiencing the processes of cell division
and proliferation controlled mainly by nutrient and temperature. The study period is
an extremely dry period with precipitation of 707 mm year
À1
. We also predict the
contribution of atmospheric N depositions under three typical meteorological years
(P ¼ 10%, 50%, 90%) according to Pearson Type III distribution (1956–2011)
(Griffis and Stedinger 2007) to validate the robustness of our result. Figure 12.11
demonstrated that precipitation was 1305.3, 974.4, and 741.5 mm year
À1 at 10th,
50th, and 90th percentiles (P r ) of the Pearson type III distribution, respectively.
Accordingly, both river discharges and wet deposition fluxes were then linearly
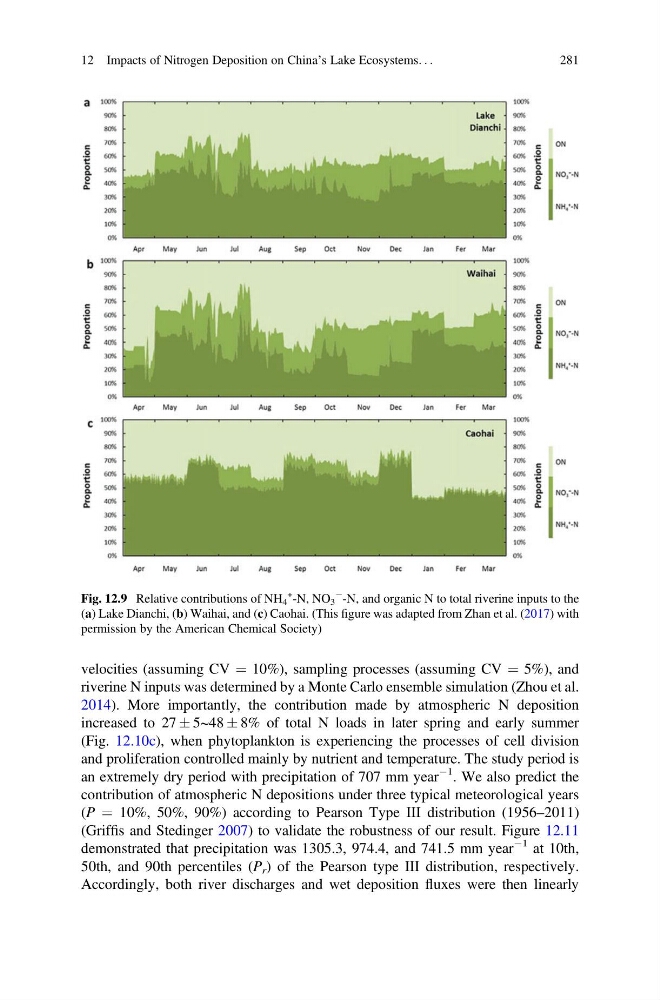
Fig. 12.9 Relative contributions of NH 4
+ -N, NO 3
À
-N, and organic N to total riverine inputs to the
(a) Lake Dianchi, (b) Waihai, and (c) Caohai. (This figure was adapted from Zhan et al. (2017) with
permission by the American Chemical Society)
12 Impacts of Nitrogen Deposition on China’s Lake Ecosystems. . .
281
riverine N inputs was determined by a Monte Carlo ensemble simulation (Zhou et al.
2014). More importantly, the contribution made by atmospheric N deposition
increased to 27 Æ 5~48 Æ 8% of total N loads in later spring and early summer
(Fig. 12.10c), when phytoplankton is experiencing the processes of cell division
and proliferation controlled mainly by nutrient and temperature. The study period is
an extremely dry period with precipitation of 707 mm year
À1
. We also predict the
contribution of atmospheric N depositions under three typical meteorological years
(P ¼ 10%, 50%, 90%) according to Pearson Type III distribution (1956–2011)
(Griffis and Stedinger 2007) to validate the robustness of our result. Figure 12.11
demonstrated that precipitation was 1305.3, 974.4, and 741.5 mm year
À1 at 10th,
50th, and 90th percentiles (P r ) of the Pearson type III distribution, respectively.
Accordingly, both river discharges and wet deposition fluxes were then linearly
Fig. 12.9 Relative contributions of NH 4
+ -N, NO 3
À
-N, and organic N to total riverine inputs to the
(a) Lake Dianchi, (b) Waihai, and (c) Caohai. (This figure was adapted from Zhan et al. (2017) with
permission by the American Chemical Society)
12 Impacts of Nitrogen Deposition on China’s Lake Ecosystems. . .
281