

deposition similar to or higher than the S deposition (Yu et al. 2017b). It indicated
that there should be a stronger removal process of N than S in the watersheds, and
thus the N deposition contributes less than S deposition to the surface water
acidification in China.
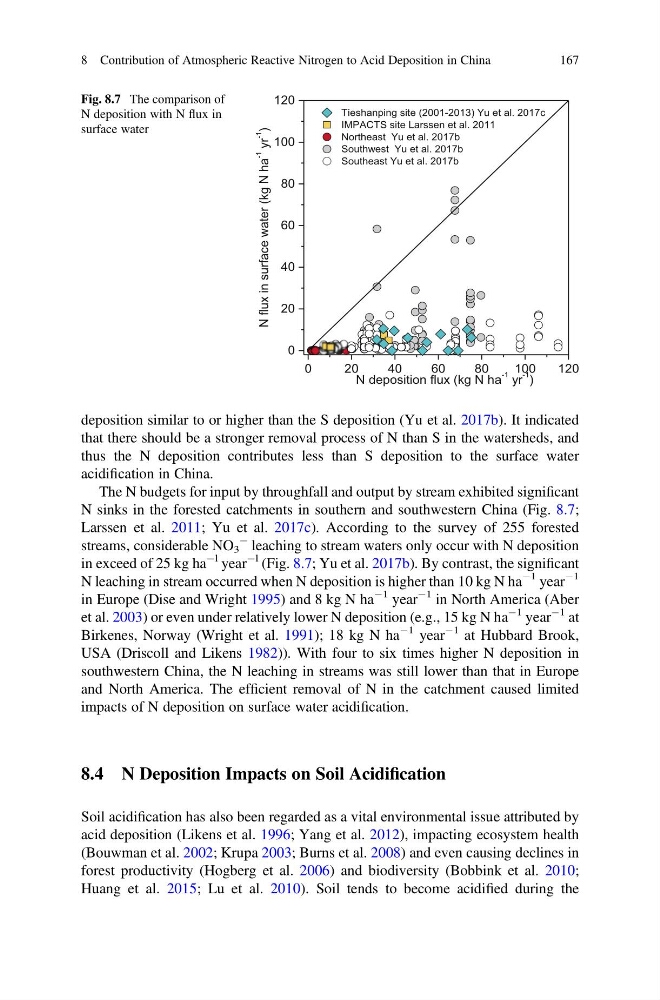
The N budgets for input by throughfall and output by stream exhibited significant
N sinks in the forested catchments in southern and southwestern China (Fig. 8.7;
Larssen et al. 2011; Yu et al. 2017c). According to the survey of 255 forested
streams, considerable NO 3
À leaching to stream waters only occur with N deposition
in exceed of 25 kg ha
Àl year
Àl (Fig. 8.7; Yu et al. 2017b). By contrast, the significant
N leaching in stream occurred when N deposition is higher than 10 kg N ha
À1 year
À1
in Europe (Dise and Wright 1995) and 8 kg N ha
À1 year
À1 in North America (Aber
et al. 2003) or even under relatively lower N deposition (e.g., 15 kg N ha
À1 year
À1 at
Birkenes, Norway (Wright et al. 1991); 18 kg N ha
À1 year
À1 at Hubbard Brook,
USA (Driscoll and Likens 1982)). With four to six times higher N deposition in
southwestern China, the N leaching in streams was still lower than that in Europe
and North America. The efficient removal of N in the catchment caused limited
impacts of N deposition on surface water acidification.
8.4 N Deposition Impacts on Soil Acidification
Soil acidification has also been regarded as a vital environmental issue attributed by
acid deposition (Likens et al. 1996; Yang et al. 2012), impacting ecosystem health
(Bouwman et al. 2002; Krupa 2003; Burns et al. 2008) and even causing declines in
forest productivity (Hogberg et al. 2006) and biodiversity (Bobbink et al. 2010;
Huang et al. 2015; Lu et al. 2010). Soil tends to become acidified during the
0
2 0
4 0
6 0
8 0
1 0 0
1 2 0
0
20
40
60
80
100
120
Tieshanping site (2001-2013) Yu et al. 2017c
IMPACTS site Larssen et al. 2011
Northeast Yu et al. 2017b
Southwest Yu et al. 2017b
Southeast Yu et al. 2017b
a
h
N
g
k
(
r
e
t
a
w
e
c
a
f
r
u
s
n
i
x
u
l
f
N
-1
yr
-1
)
N deposition flux (kg N ha
-1 yr
-1
)
Fig. 8.7 The comparison of
N deposition with N flux in
surface water
8 Contribution of Atmospheric Reactive Nitrogen to Acid Deposition in China
167
that there should be a stronger removal process of N than S in the watersheds, and
thus the N deposition contributes less than S deposition to the surface water
acidification in China.
The N budgets for input by throughfall and output by stream exhibited significant
N sinks in the forested catchments in southern and southwestern China (Fig. 8.7;
Larssen et al. 2011; Yu et al. 2017c). According to the survey of 255 forested
streams, considerable NO 3
À leaching to stream waters only occur with N deposition
in exceed of 25 kg ha
Àl year
Àl (Fig. 8.7; Yu et al. 2017b). By contrast, the significant
N leaching in stream occurred when N deposition is higher than 10 kg N ha
À1 year
À1
in Europe (Dise and Wright 1995) and 8 kg N ha
À1 year
À1 in North America (Aber
et al. 2003) or even under relatively lower N deposition (e.g., 15 kg N ha
À1 year
À1 at
Birkenes, Norway (Wright et al. 1991); 18 kg N ha
À1 year
À1 at Hubbard Brook,
USA (Driscoll and Likens 1982)). With four to six times higher N deposition in
southwestern China, the N leaching in streams was still lower than that in Europe
and North America. The efficient removal of N in the catchment caused limited
impacts of N deposition on surface water acidification.
8.4 N Deposition Impacts on Soil Acidification
Soil acidification has also been regarded as a vital environmental issue attributed by
acid deposition (Likens et al. 1996; Yang et al. 2012), impacting ecosystem health
(Bouwman et al. 2002; Krupa 2003; Burns et al. 2008) and even causing declines in
forest productivity (Hogberg et al. 2006) and biodiversity (Bobbink et al. 2010;
Huang et al. 2015; Lu et al. 2010). Soil tends to become acidified during the
0
2 0
4 0
6 0
8 0
1 0 0
1 2 0
0
20
40
60
80
100
120
Tieshanping site (2001-2013) Yu et al. 2017c
IMPACTS site Larssen et al. 2011
Northeast Yu et al. 2017b
Southwest Yu et al. 2017b
Southeast Yu et al. 2017b
a
h
N
g
k
(
r
e
t
a
w
e
c
a
f
r
u
s
n
i
x
u
l
f
N
-1
yr
-1
)
N deposition flux (kg N ha
-1 yr
-1
)
Fig. 8.7 The comparison of
N deposition with N flux in
surface water
8 Contribution of Atmospheric Reactive Nitrogen to Acid Deposition in China
167