

387
that the dryer is seen more as an enterprise, rather than a development initiative for
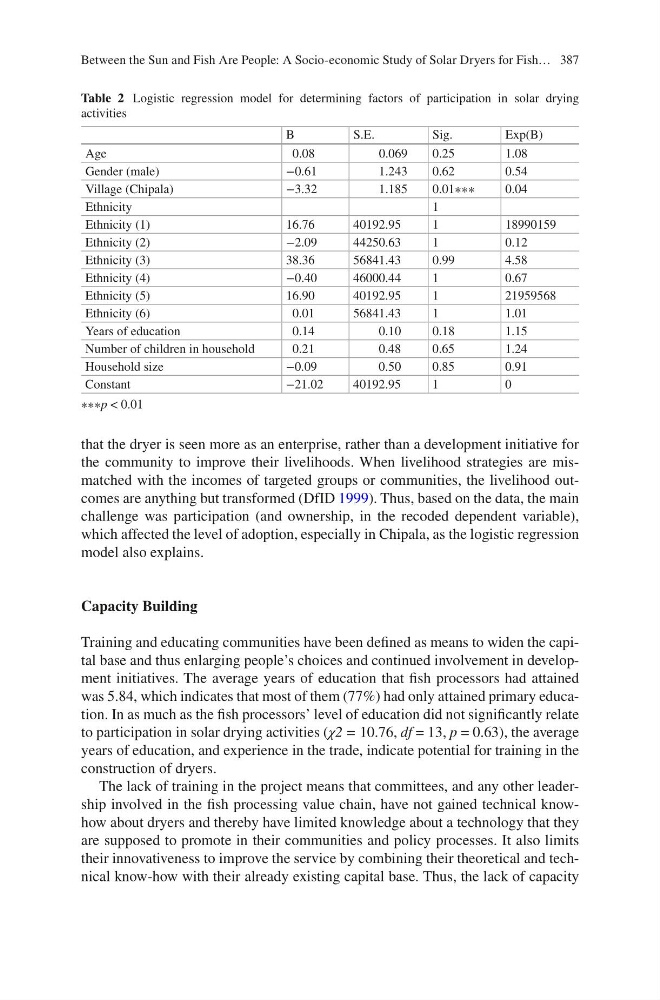
the community to improve their livelihoods. When livelihood strategies are mismatched with the incomes of targeted groups or communities, the livelihood outcomes are anything but transformed (DfID 1999). Thus, based on the data, the main
challenge was participation (and ownership, in the recoded dependent variable),
which affected the level of adoption, especially in Chipala, as the logistic regression
model also explains.
Capacity Building
Training and educating communities have been defined as means to widen the capital base and thus enlarging people’s choices and continued involvement in development initiatives. The average years of education that fish processors had attained
was 5.84, which indicates that most of them (77%) had only attained primary education. In as much as the fish processors’ level of education did not significantly relate
to participation in solar drying activities (χ2 = 10.76, df = 13, p = 0.63), the average
years of education, and experience in the trade, indicate potential for training in the
construction of dryers.
The lack of training in the project means that committees, and any other leadership involved in the fish processing value chain, have not gained technical knowhow about dryers and thereby have limited knowledge about a technology that they
are supposed to promote in their communities and policy processes. It also limits
their innovativeness to improve the service by combining their theoretical and technical know-how with their already existing capital base. Thus, the lack of capacity
Table 2 Logistic regression model for determining factors of participation in solar drying
activities
B
S.E.
Sig.
Exp(B)
Age
0.08
0.069
0.25
1.08
Gender (male)
−0.61
1.243
0.62
0.54
Village (Chipala)
−3.32
1.185
0.01∗∗∗
0.04
Ethnicity
1
Ethnicity (1)
16.76
40192.95
1
18990159
Ethnicity (2)
−2.09
44250.63
1
0.12
Ethnicity (3)
38.36
56841.43
0.99
4.58
Ethnicity (4)
−0.40
46000.44
1
0.67
Ethnicity (5)
16.90
40192.95
1
21959568
Ethnicity (6)
0.01
56841.43
1
1.01
Years of education
0.14
0.10
0.18
1.15
Number of children in household
0.21
0.48
0.65
1.24
Household size
−0.09
0.50
0.85
0.91
Constant
−21.02
40192.95
1
0
∗∗∗p < 0.01
Between the Sun and Fish Are People: A Socio-economic Study of Solar Dryers for Fish…
that the dryer is seen more as an enterprise, rather than a development initiative for
the community to improve their livelihoods. When livelihood strategies are mismatched with the incomes of targeted groups or communities, the livelihood outcomes are anything but transformed (DfID 1999). Thus, based on the data, the main
challenge was participation (and ownership, in the recoded dependent variable),
which affected the level of adoption, especially in Chipala, as the logistic regression
model also explains.
Capacity Building
Training and educating communities have been defined as means to widen the capital base and thus enlarging people’s choices and continued involvement in development initiatives. The average years of education that fish processors had attained
was 5.84, which indicates that most of them (77%) had only attained primary education. In as much as the fish processors’ level of education did not significantly relate
to participation in solar drying activities (χ2 = 10.76, df = 13, p = 0.63), the average
years of education, and experience in the trade, indicate potential for training in the
construction of dryers.
The lack of training in the project means that committees, and any other leadership involved in the fish processing value chain, have not gained technical knowhow about dryers and thereby have limited knowledge about a technology that they
are supposed to promote in their communities and policy processes. It also limits
their innovativeness to improve the service by combining their theoretical and technical know-how with their already existing capital base. Thus, the lack of capacity
Table 2 Logistic regression model for determining factors of participation in solar drying
activities
B
S.E.
Sig.
Exp(B)
Age
0.08
0.069
0.25
1.08
Gender (male)
−0.61
1.243
0.62
0.54
Village (Chipala)
−3.32
1.185
0.01∗∗∗
0.04
Ethnicity
1
Ethnicity (1)
16.76
40192.95
1
18990159
Ethnicity (2)
−2.09
44250.63
1
0.12
Ethnicity (3)
38.36
56841.43
0.99
4.58
Ethnicity (4)
−0.40
46000.44
1
0.67
Ethnicity (5)
16.90
40192.95
1
21959568
Ethnicity (6)
0.01
56841.43
1
1.01
Years of education
0.14
0.10
0.18
1.15
Number of children in household
0.21
0.48
0.65
1.24
Household size
−0.09
0.50
0.85
0.91
Constant
−21.02
40192.95
1
0
∗∗∗p < 0.01
Between the Sun and Fish Are People: A Socio-economic Study of Solar Dryers for Fish…