

244
No additional feed
Additional feed
0.00
0.25
0.50
0.75
1.00
0
100
200
300
400
500
Days after previous calving
Probability of no calving
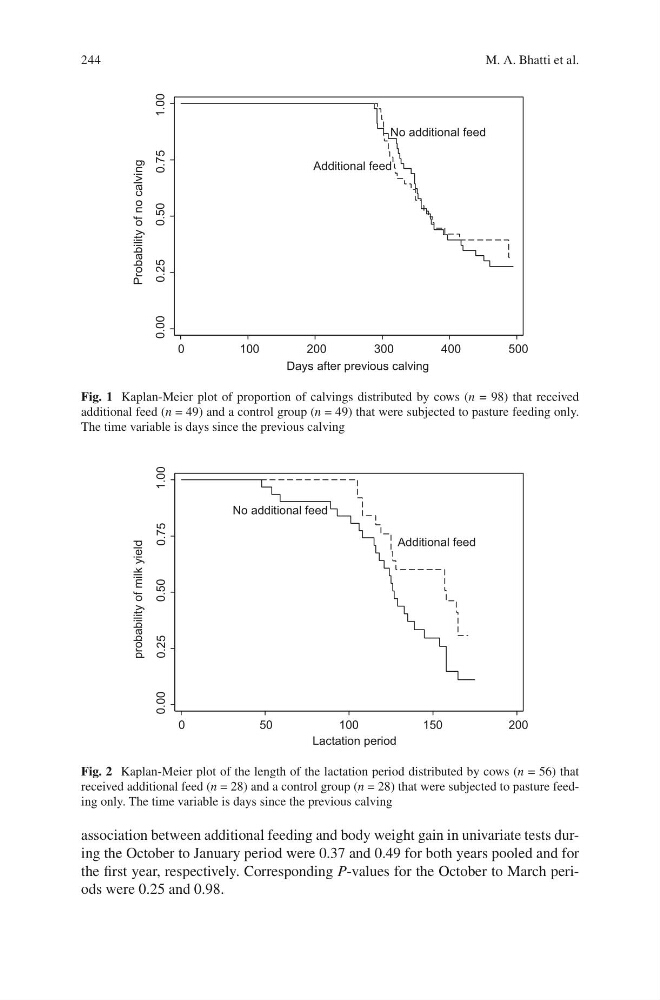
Fig. 1 Kaplan-Meier plot of proportion of calvings distributed by cows (n = 98) that received
additional feed (n = 49) and a control group (n = 49) that were subjected to pasture feeding only.
The time variable is days since the previous calving
No additional feed
Additional feed
0.00
0.25
0.50
0.75
1.00
0
50
100
150
200
Lactation period
probability of milk yield
Fig. 2 Kaplan-Meier plot of the length of the lactation period distributed by cows (n = 56) that
received additional feed (n = 28) and a control group (n = 28) that were subjected to pasture feeding only. The time variable is days since the previous calving
association between additional feeding and body weight gain in univariate tests during the October to January period were 0.37 and 0.49 for both years pooled and for
the first year, respectively. Corresponding P-values for the October to March periods were 0.25 and 0.98.
M. A. Bhatti et al.
No additional feed
Additional feed
0.00
0.25
0.50
0.75
1.00
0
100
200
300
400
500
Days after previous calving
Probability of no calving
Fig. 1 Kaplan-Meier plot of proportion of calvings distributed by cows (n = 98) that received
additional feed (n = 49) and a control group (n = 49) that were subjected to pasture feeding only.
The time variable is days since the previous calving
No additional feed
Additional feed
0.00
0.25
0.50
0.75
1.00
0
50
100
150
200
Lactation period
probability of milk yield
Fig. 2 Kaplan-Meier plot of the length of the lactation period distributed by cows (n = 56) that
received additional feed (n = 28) and a control group (n = 28) that were subjected to pasture feeding only. The time variable is days since the previous calving
association between additional feeding and body weight gain in univariate tests during the October to January period were 0.37 and 0.49 for both years pooled and for
the first year, respectively. Corresponding P-values for the October to March periods were 0.25 and 0.98.
M. A. Bhatti et al.