

234
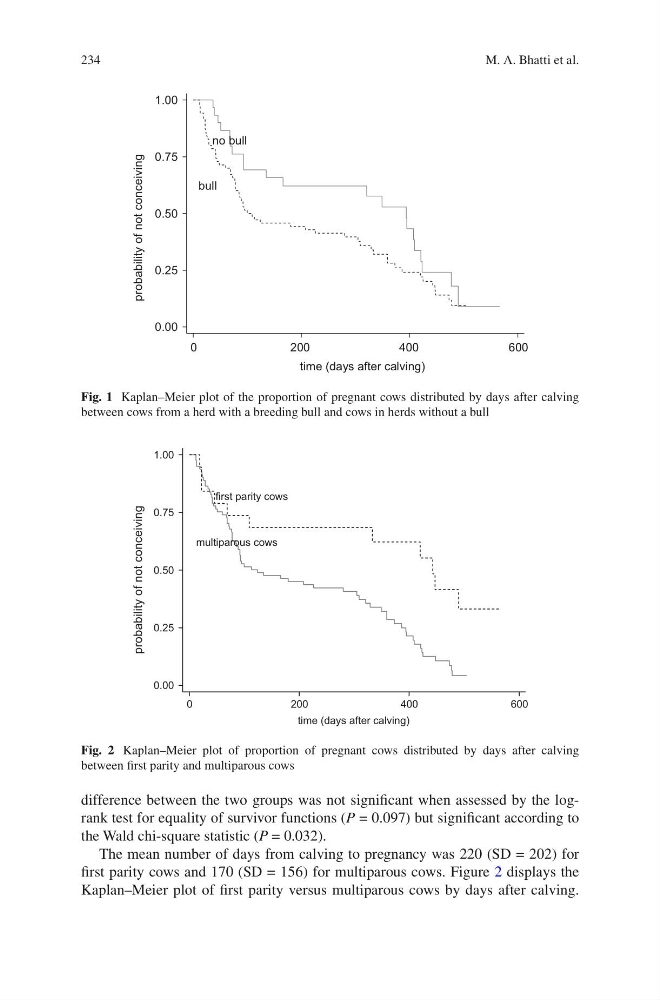
difference between the two groups was not significant when assessed by the logrank test for equality of survivor functions (P = 0.097) but significant according to
the Wald chi-square statistic (P = 0.032).
The mean number of days from calving to pregnancy was 220 (SD = 202) for
first parity cows and 170 (SD = 156) for multiparous cows. Figure 2 displays the
Kaplan–Meier plot of first parity versus multiparous cows by days after calving.
no bull
bull
0.00
0.25
0.50
0.75
1.00
0
200
400
600
time (days after calving)
probability of not conceiving
Fig. 1 Kaplan–Meier plot of the proportion of pregnant cows distributed by days after calving
between cows from a herd with a breeding bull and cows in herds without a bull
first parity cows
multiparous cows
0.00
0.25
0.50
0.75
1.00
0
200
400
600
time (days after calving)
probability of not conceiving
Fig. 2 Kaplan–Meier plot of proportion of pregnant cows distributed by days after calving
between first parity and multiparous cows
M. A. Bhatti et al.
difference between the two groups was not significant when assessed by the logrank test for equality of survivor functions (P = 0.097) but significant according to
the Wald chi-square statistic (P = 0.032).
The mean number of days from calving to pregnancy was 220 (SD = 202) for
first parity cows and 170 (SD = 156) for multiparous cows. Figure 2 displays the
Kaplan–Meier plot of first parity versus multiparous cows by days after calving.
no bull
bull
0.00
0.25
0.50
0.75
1.00
0
200
400
600
time (days after calving)
probability of not conceiving
Fig. 1 Kaplan–Meier plot of the proportion of pregnant cows distributed by days after calving
between cows from a herd with a breeding bull and cows in herds without a bull
first parity cows
multiparous cows
0.00
0.25
0.50
0.75
1.00
0
200
400
600
time (days after calving)
probability of not conceiving
Fig. 2 Kaplan–Meier plot of proportion of pregnant cows distributed by days after calving
between first parity and multiparous cows
M. A. Bhatti et al.