

233
After three farmers had withdrawn, the number of bulls per farm ranged from
zero to four, and 30 (out of 100) cows originated from 17 farms with no breeding
bull in the herd. The primiparous cows (n = 19) of the cohort study originated from
13 farms.
The mean calving interval in 78 cows that subsequently delivered a live calf was
457.4 days with a standard deviation (SD) of 163.0 days, which corresponds to a
mean period from calving to pregnancy of 177.4 days. The variance component
analysis of the calving intervals from these 78 cows showed that 32% of the variance in calving interval resided at the herd level, with significant variation in calving
interval between herds (P = 0.008), indicating an important contribution of herd
management to reproductive outcome. The variance in calving interval between
agricultural sections was not significant, indicating minimal geographical differences in reproductive efficiency within the study area.
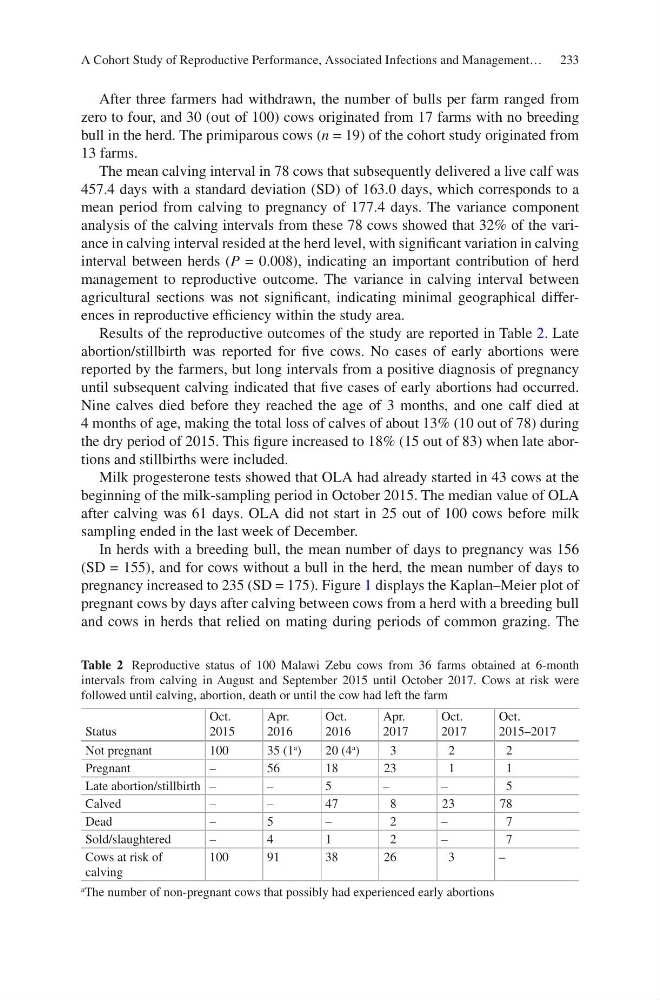
Results of the reproductive outcomes of the study are reported in Table 2. Late
abortion/stillbirth was reported for five cows. No cases of early abortions were
reported by the farmers, but long intervals from a positive diagnosis of pregnancy
until subsequent calving indicated that five cases of early abortions had occurred.
Nine calves died before they reached the age of 3 months, and one calf died at
4 months of age, making the total loss of calves of about 13% (10 out of 78) during
the dry period of 2015. This figure increased to 18% (15 out of 83) when late abortions and stillbirths were included.
Milk progesterone tests showed that OLA had already started in 43 cows at the
beginning of the milk-sampling period in October 2015. The median value of OLA
after calving was 61 days. OLA did not start in 25 out of 100 cows before milk
sampling ended in the last week of December.
In herds with a breeding bull, the mean number of days to pregnancy was 156
(SD = 155), and for cows without a bull in the herd, the mean number of days to
pregnancy increased to 235 (SD = 175). Figure 1 displays the Kaplan–Meier plot of
pregnant cows by days after calving between cows from a herd with a breeding bull
and cows in herds that relied on mating during periods of common grazing. The
Table 2 Reproductive status of 100 Malawi Zebu cows from 36 farms obtained at 6-month
intervals from calving in August and September 2015 until October 2017. Cows at risk were
followed until calving, abortion, death or until the cow had left the farm
Status
Oct.
2015
Apr.
2016
Oct.
2016
Apr.
2017
Oct.
2017
Oct.
2015–2017
Not pregnant
100
35 (1
a
)
20 (4
a
)
3
2
2
Pregnant
–
56
18
23
1
1
Late abortion/stillbirth –
–
5
–
–
5
Calved
–
–
47
8
23
78
Dead
–
5
–
2
–
7
Sold/slaughtered
–
4
1
2
–
7
Cows at risk of
calving
100
91
38
26
3
–
a The number of non-pregnant cows that possibly had experienced early abortions
A Cohort Study of Reproductive Performance, Associated Infections and Management…
After three farmers had withdrawn, the number of bulls per farm ranged from
zero to four, and 30 (out of 100) cows originated from 17 farms with no breeding
bull in the herd. The primiparous cows (n = 19) of the cohort study originated from
13 farms.
The mean calving interval in 78 cows that subsequently delivered a live calf was
457.4 days with a standard deviation (SD) of 163.0 days, which corresponds to a
mean period from calving to pregnancy of 177.4 days. The variance component
analysis of the calving intervals from these 78 cows showed that 32% of the variance in calving interval resided at the herd level, with significant variation in calving
interval between herds (P = 0.008), indicating an important contribution of herd
management to reproductive outcome. The variance in calving interval between
agricultural sections was not significant, indicating minimal geographical differences in reproductive efficiency within the study area.
Results of the reproductive outcomes of the study are reported in Table 2. Late
abortion/stillbirth was reported for five cows. No cases of early abortions were
reported by the farmers, but long intervals from a positive diagnosis of pregnancy
until subsequent calving indicated that five cases of early abortions had occurred.
Nine calves died before they reached the age of 3 months, and one calf died at
4 months of age, making the total loss of calves of about 13% (10 out of 78) during
the dry period of 2015. This figure increased to 18% (15 out of 83) when late abortions and stillbirths were included.
Milk progesterone tests showed that OLA had already started in 43 cows at the
beginning of the milk-sampling period in October 2015. The median value of OLA
after calving was 61 days. OLA did not start in 25 out of 100 cows before milk
sampling ended in the last week of December.
In herds with a breeding bull, the mean number of days to pregnancy was 156
(SD = 155), and for cows without a bull in the herd, the mean number of days to
pregnancy increased to 235 (SD = 175). Figure 1 displays the Kaplan–Meier plot of
pregnant cows by days after calving between cows from a herd with a breeding bull
and cows in herds that relied on mating during periods of common grazing. The
Table 2 Reproductive status of 100 Malawi Zebu cows from 36 farms obtained at 6-month
intervals from calving in August and September 2015 until October 2017. Cows at risk were
followed until calving, abortion, death or until the cow had left the farm
Status
Oct.
2015
Apr.
2016
Oct.
2016
Apr.
2017
Oct.
2017
Oct.
2015–2017
Not pregnant
100
35 (1
a
)
20 (4
a
)
3
2
2
Pregnant
–
56
18
23
1
1
Late abortion/stillbirth –
–
5
–
–
5
Calved
–
–
47
8
23
78
Dead
–
5
–
2
–
7
Sold/slaughtered
–
4
1
2
–
7
Cows at risk of
calving
100
91
38
26
3
–
a The number of non-pregnant cows that possibly had experienced early abortions
A Cohort Study of Reproductive Performance, Associated Infections and Management…