

47
turbation to the system’s Hamiltonian according to the following
relation:
′ ( ) = ( ) + ( )
V r
V r
W r
N
N
N
where W(r
N
) is a weighting function which ensures that all possible
states will be sampled even if they are away from equilibrium. This
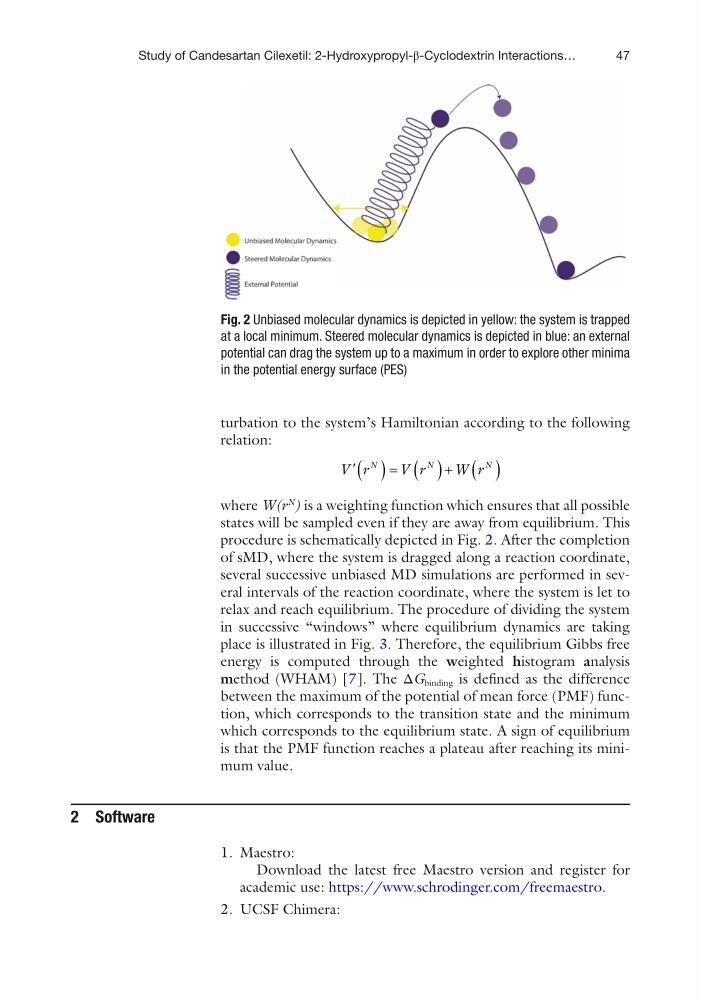
procedure is schematically depicted in Fig. 2. After the completion
of sMD, where the system is dragged along a reaction coordinate,
several successive unbiased MD simulations are performed in several intervals of the reaction coordinate, where the system is let to
relax and reach equilibrium. The procedure of dividing the system
in successive “windows” where equilibrium dynamics are taking
place is illustrated in Fig. 3. Therefore, the equilibrium Gibbs free
energy is computed through the weighted histogram analysis
method (WHAM) [7]. The ΔG binding is defined as the difference
between the maximum of the potential of mean force (PMF) function, which corresponds to the transition state and the minimum
which corresponds to the equilibrium state. A sign of equilibrium
is that the PMF function reaches a plateau after reaching its minimum value.
2 Software
1. Maestro:
Download the latest free Maestro version and register for
academic use: https://www.schrodinger.com/freemaestro.
2. UCSF Chimera:
Fig. 2 Unbiased molecular dynamics is depicted in yellow: the system is trapped
at a local minimum. Steered molecular dynamics is depicted in blue: an external
potential can drag the system up to a maximum in order to explore other minima
in the potential energy surface (PES)
Study of Candesartan Cilexetil: 2-Hydroxypropyl-β-Cyclodextrin Interactions…
turbation to the system’s Hamiltonian according to the following
relation:
′ ( ) = ( ) + ( )
V r
V r
W r
N
N
N
where W(r
N
) is a weighting function which ensures that all possible
states will be sampled even if they are away from equilibrium. This
procedure is schematically depicted in Fig. 2. After the completion
of sMD, where the system is dragged along a reaction coordinate,
several successive unbiased MD simulations are performed in several intervals of the reaction coordinate, where the system is let to
relax and reach equilibrium. The procedure of dividing the system
in successive “windows” where equilibrium dynamics are taking
place is illustrated in Fig. 3. Therefore, the equilibrium Gibbs free
energy is computed through the weighted histogram analysis
method (WHAM) [7]. The ΔG binding is defined as the difference
between the maximum of the potential of mean force (PMF) function, which corresponds to the transition state and the minimum
which corresponds to the equilibrium state. A sign of equilibrium
is that the PMF function reaches a plateau after reaching its minimum value.
2 Software
1. Maestro:
Download the latest free Maestro version and register for
academic use: https://www.schrodinger.com/freemaestro.
2. UCSF Chimera:
Fig. 2 Unbiased molecular dynamics is depicted in yellow: the system is trapped
at a local minimum. Steered molecular dynamics is depicted in blue: an external
potential can drag the system up to a maximum in order to explore other minima
in the potential energy surface (PES)
Study of Candesartan Cilexetil: 2-Hydroxypropyl-β-Cyclodextrin Interactions…