

194
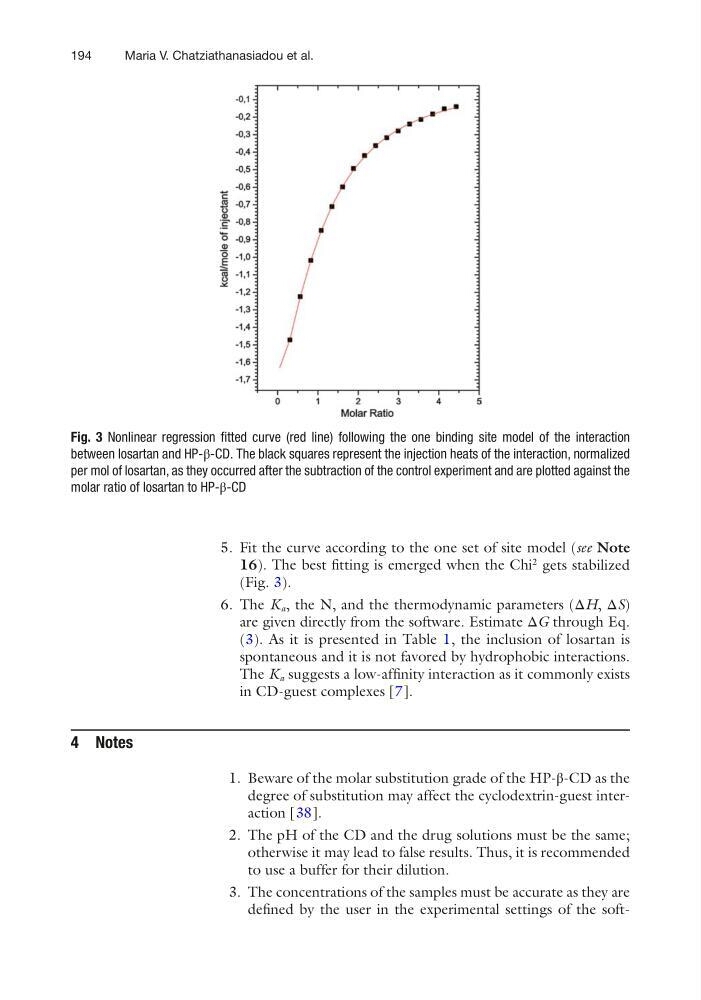
5. Fit the curve according to the one set of site model (see Note
16). The best fitting is emerged when the Chi
2
gets stabilized
(Fig. 3).
6. The K a , the N, and the thermodynamic parameters (ΔH, ΔS)
are given directly from the software. Estimate ΔG through Eq.
(3). As it is presented in Table 1, the inclusion of losartan is
spontaneous and it is not favored by hydrophobic interactions.
The K a suggests a low-affinity interaction as it commonly exists
in CD-guest complexes [7].
4 Notes
1. Beware of the molar substitution grade of the HP-β-CD as the
degree of substitution may affect the cyclodextrin-guest interaction [38].
2. The pH of the CD and the drug solutions must be the same;
otherwise it may lead to false results. Thus, it is recommended
to use a buffer for their dilution.
3. The concentrations of the samples must be accurate as they are
defined by the user in the experimental settings of the softFig. 3 Nonlinear regression fitted curve (red line) following the one binding site model of the interaction
between losartan and HP-β-CD. The black squares represent the injection heats of the interaction, normalized
per mol of losartan, as they occurred after the subtraction of the control experiment and are plotted against the
molar ratio of losartan to HP-β-CD
Maria V. Chatziathanasiadou et al.
5. Fit the curve according to the one set of site model (see Note
16). The best fitting is emerged when the Chi
2
gets stabilized
(Fig. 3).
6. The K a , the N, and the thermodynamic parameters (ΔH, ΔS)
are given directly from the software. Estimate ΔG through Eq.
(3). As it is presented in Table 1, the inclusion of losartan is
spontaneous and it is not favored by hydrophobic interactions.
The K a suggests a low-affinity interaction as it commonly exists
in CD-guest complexes [7].
4 Notes
1. Beware of the molar substitution grade of the HP-β-CD as the
degree of substitution may affect the cyclodextrin-guest interaction [38].
2. The pH of the CD and the drug solutions must be the same;
otherwise it may lead to false results. Thus, it is recommended
to use a buffer for their dilution.
3. The concentrations of the samples must be accurate as they are
defined by the user in the experimental settings of the softFig. 3 Nonlinear regression fitted curve (red line) following the one binding site model of the interaction
between losartan and HP-β-CD. The black squares represent the injection heats of the interaction, normalized
per mol of losartan, as they occurred after the subtraction of the control experiment and are plotted against the
molar ratio of losartan to HP-β-CD
Maria V. Chatziathanasiadou et al.