

193
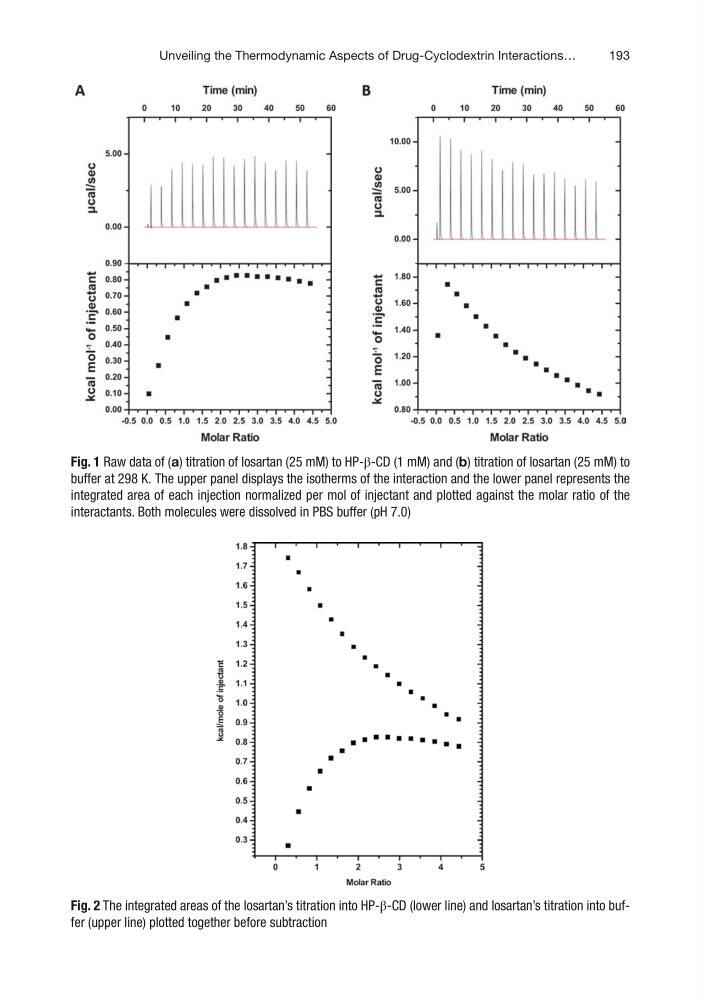
Fig. 1 Raw data of (a) titration of losartan (25 mM) to HP-β-CD (1 mM) and (b) titration of losartan (25 mM) to
buffer at 298 K. The upper panel displays the isotherms of the interaction and the lower panel represents the
integrated area of each injection normalized per mol of injectant and plotted against the molar ratio of the
interactants. Both molecules were dissolved in PBS buffer (pH 7.0)
Fig. 2 The integrated areas of the losartan’s titration into HP-β-CD (lower line) and losartan’s titration into buffer (upper line) plotted together before subtraction
Unveiling the Thermodynamic Aspects of Drug-Cyclodextrin Interactions…
Fig. 1 Raw data of (a) titration of losartan (25 mM) to HP-β-CD (1 mM) and (b) titration of losartan (25 mM) to
buffer at 298 K. The upper panel displays the isotherms of the interaction and the lower panel represents the
integrated area of each injection normalized per mol of injectant and plotted against the molar ratio of the
interactants. Both molecules were dissolved in PBS buffer (pH 7.0)
Fig. 2 The integrated areas of the losartan’s titration into HP-β-CD (lower line) and losartan’s titration into buffer (upper line) plotted together before subtraction
Unveiling the Thermodynamic Aspects of Drug-Cyclodextrin Interactions…