

182
1. Dissolve TMZ and complex in 500 μL phosphate buffer
pH 7.1 in D 2 O.
2. Add tetramethylsilane (TMS) as internal standard.
3. Incubate samples under shaking at 37 °C ± 0.1.
4. Remove the samples from the bath at time intervals of 0, 2, 4,
6, 8, 16, and 24 h.
5. Transfer samples to 5 mm NMR tubes to analyze.
6. Load the sample into the Bruker AV-400 spectrometer.
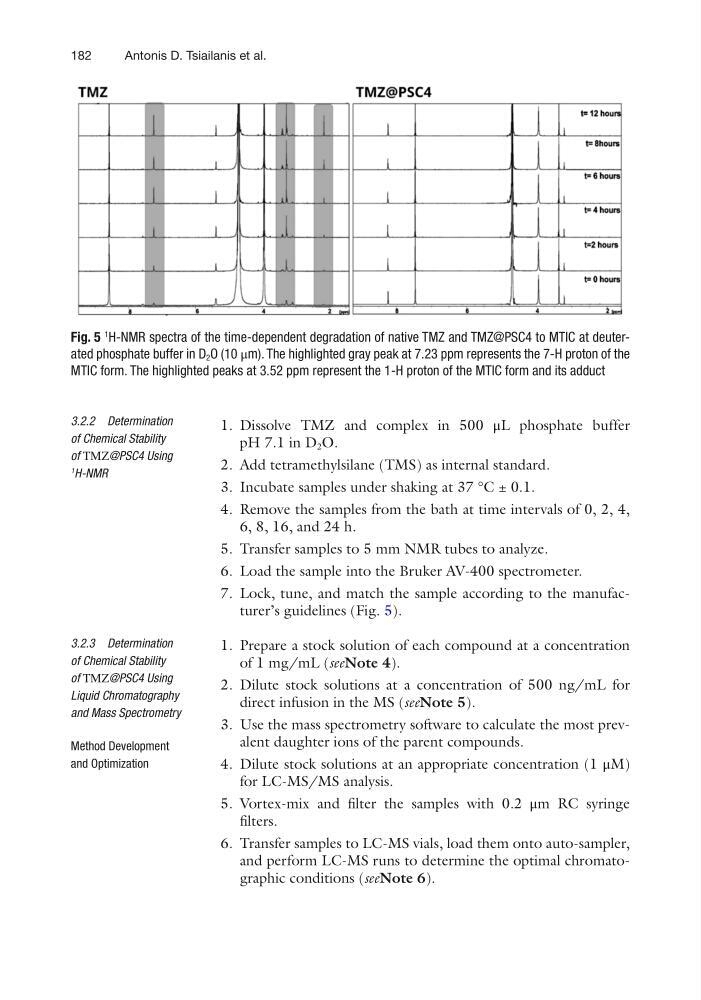
7. Lock, tune, and match the sample according to the manufacturer’s guidelines (Fig. 5).
1. Prepare a stock solution of each compound at a concentration
of 1 mg/mL (seeNote 4).
2. Dilute stock solutions at a concentration of 500 ng/mL for
direct infusion in the MS (seeNote 5).
3. Use the mass spectrometry software to calculate the most prevalent daughter ions of the parent compounds.
4. Dilute stock solutions at an appropriate concentration (1 μM)
for LC-MS/MS analysis.
5. Vortex-mix and filter the samples with 0.2 μm RC syringe
filters.
6. Transfer samples to LC-MS vials, load them onto auto-sampler,
and perform LC-MS runs to determine the optimal chromatographic conditions (seeNote 6).
3.2.2 Determination
of Chemical Stability
of ΤΜΖ@PSC4 Using
1
H-NMR
3.2.3 Determination
of Chemical Stability
of ΤΜΖ@PSC4 Using
Liquid Chromatography
and Mass Spectrometry
Method Development
and Optimization
Fig. 5
1
H-NMR spectra of the time-dependent degradation of native TMZ and TMZ@PSC4 to MTIC at deuterated phosphate buffer in D 2 O (10 μm). The highlighted gray peak at 7.23 ppm represents the 7-H proton of the
MTIC form. The highlighted peaks at 3.52 ppm represent the 1-H proton of the MTIC form and its adduct
Antonis D. Tsiailanis et al.
1. Dissolve TMZ and complex in 500 μL phosphate buffer
pH 7.1 in D 2 O.
2. Add tetramethylsilane (TMS) as internal standard.
3. Incubate samples under shaking at 37 °C ± 0.1.
4. Remove the samples from the bath at time intervals of 0, 2, 4,
6, 8, 16, and 24 h.
5. Transfer samples to 5 mm NMR tubes to analyze.
6. Load the sample into the Bruker AV-400 spectrometer.
7. Lock, tune, and match the sample according to the manufacturer’s guidelines (Fig. 5).
1. Prepare a stock solution of each compound at a concentration
of 1 mg/mL (seeNote 4).
2. Dilute stock solutions at a concentration of 500 ng/mL for
direct infusion in the MS (seeNote 5).
3. Use the mass spectrometry software to calculate the most prevalent daughter ions of the parent compounds.
4. Dilute stock solutions at an appropriate concentration (1 μM)
for LC-MS/MS analysis.
5. Vortex-mix and filter the samples with 0.2 μm RC syringe
filters.
6. Transfer samples to LC-MS vials, load them onto auto-sampler,
and perform LC-MS runs to determine the optimal chromatographic conditions (seeNote 6).
3.2.2 Determination
of Chemical Stability
of ΤΜΖ@PSC4 Using
1
H-NMR
3.2.3 Determination
of Chemical Stability
of ΤΜΖ@PSC4 Using
Liquid Chromatography
and Mass Spectrometry
Method Development
and Optimization
Fig. 5
1
H-NMR spectra of the time-dependent degradation of native TMZ and TMZ@PSC4 to MTIC at deuterated phosphate buffer in D 2 O (10 μm). The highlighted gray peak at 7.23 ppm represents the 7-H proton of the
MTIC form. The highlighted peaks at 3.52 ppm represent the 1-H proton of the MTIC form and its adduct
Antonis D. Tsiailanis et al.