

Measuring the Effectiveness of Sustainability-Related Course …
541
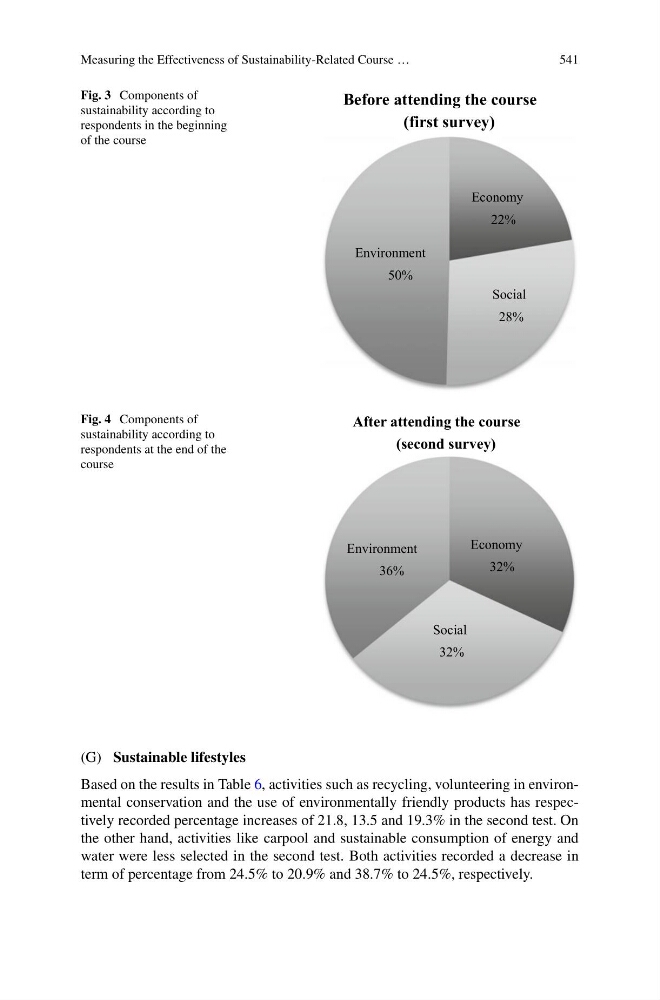
Fig. 3 Components of
sustainability according to
respondents in the beginning
of the course
Economy
22%
Social
28%
Environment
50%
Before attending the course
(first survey)
Fig. 4 Components of
sustainability according to
respondents at the end of the
course
Economy
32%
Social
32%
Environment
36%
After attending the course
(second survey)
(G) Sustainable lifestyles
Based on the results in Table 6, activities such as recycling, volunteering in environmental conservation and the use of environmentally friendly products has respectively recorded percentage increases of 21.8, 13.5 and 19.3% in the second test. On
the other hand, activities like carpool and sustainable consumption of energy and
water were less selected in the second test. Both activities recorded a decrease in
term of percentage from 24.5% to 20.9% and 38.7% to 24.5%, respectively.
541
Fig. 3 Components of
sustainability according to
respondents in the beginning
of the course
Economy
22%
Social
28%
Environment
50%
Before attending the course
(first survey)
Fig. 4 Components of
sustainability according to
respondents at the end of the
course
Economy
32%
Social
32%
Environment
36%
After attending the course
(second survey)
(G) Sustainable lifestyles
Based on the results in Table 6, activities such as recycling, volunteering in environmental conservation and the use of environmentally friendly products has respectively recorded percentage increases of 21.8, 13.5 and 19.3% in the second test. On
the other hand, activities like carpool and sustainable consumption of energy and
water were less selected in the second test. Both activities recorded a decrease in
term of percentage from 24.5% to 20.9% and 38.7% to 24.5%, respectively.