

540
T. F. Ng et al.
Table 3 Level of
understanding of sustainable
development
Item
Mean
Std. deviation
Level of
understanding
First survey
4.22
1.617
Second survey 7.32
1.305
Table 4 Level of
understanding of the course
contents
Item
Mean
Std. deviation
Level of
understanding
of the course
contents
First survey
3.99
1.536
Second survey 7.49
1.253
(D) Level of understanding of the course contents
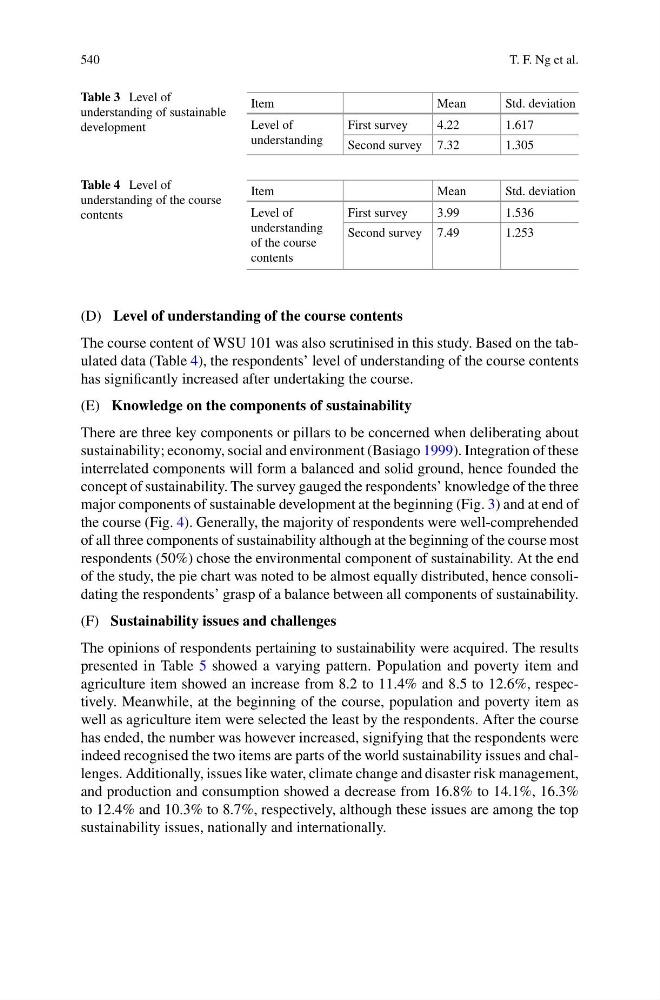
The course content of WSU 101 was also scrutinised in this study. Based on the tabulated data (Table 4), the respondents’ level of understanding of the course contents
has significantly increased after undertaking the course.
(E) Knowledge on the components of sustainability
There are three key components or pillars to be concerned when deliberating about
sustainability; economy, social and environment (Basiago 1999). Integration of these
interrelated components will form a balanced and solid ground, hence founded the
concept of sustainability. The survey gauged the respondents’ knowledge of the three
major components of sustainable development at the beginning (Fig. 3) and at end of
the course (Fig. 4). Generally, the majority of respondents were well-comprehended
of all three components of sustainability although at the beginning of the course most
respondents (50%) chose the environmental component of sustainability. At the end
of the study, the pie chart was noted to be almost equally distributed, hence consolidating the respondents’ grasp of a balance between all components of sustainability.
(F) Sustainability issues and challenges
The opinions of respondents pertaining to sustainability were acquired. The results
presented in Table 5 showed a varying pattern. Population and poverty item and
agriculture item showed an increase from 8.2 to 11.4% and 8.5 to 12.6%, respectively. Meanwhile, at the beginning of the course, population and poverty item as
well as agriculture item were selected the least by the respondents. After the course
has ended, the number was however increased, signifying that the respondents were
indeed recognised the two items are parts of the world sustainability issues and challenges. Additionally, issues like water, climate change and disaster risk management,
and production and consumption showed a decrease from 16.8% to 14.1%, 16.3%
to 12.4% and 10.3% to 8.7%, respectively, although these issues are among the top
sustainability issues, nationally and internationally.
T. F. Ng et al.
Table 3 Level of
understanding of sustainable
development
Item
Mean
Std. deviation
Level of
understanding
First survey
4.22
1.617
Second survey 7.32
1.305
Table 4 Level of
understanding of the course
contents
Item
Mean
Std. deviation
Level of
understanding
of the course
contents
First survey
3.99
1.536
Second survey 7.49
1.253
(D) Level of understanding of the course contents
The course content of WSU 101 was also scrutinised in this study. Based on the tabulated data (Table 4), the respondents’ level of understanding of the course contents
has significantly increased after undertaking the course.
(E) Knowledge on the components of sustainability
There are three key components or pillars to be concerned when deliberating about
sustainability; economy, social and environment (Basiago 1999). Integration of these
interrelated components will form a balanced and solid ground, hence founded the
concept of sustainability. The survey gauged the respondents’ knowledge of the three
major components of sustainable development at the beginning (Fig. 3) and at end of
the course (Fig. 4). Generally, the majority of respondents were well-comprehended
of all three components of sustainability although at the beginning of the course most
respondents (50%) chose the environmental component of sustainability. At the end
of the study, the pie chart was noted to be almost equally distributed, hence consolidating the respondents’ grasp of a balance between all components of sustainability.
(F) Sustainability issues and challenges
The opinions of respondents pertaining to sustainability were acquired. The results
presented in Table 5 showed a varying pattern. Population and poverty item and
agriculture item showed an increase from 8.2 to 11.4% and 8.5 to 12.6%, respectively. Meanwhile, at the beginning of the course, population and poverty item as
well as agriculture item were selected the least by the respondents. After the course
has ended, the number was however increased, signifying that the respondents were
indeed recognised the two items are parts of the world sustainability issues and challenges. Additionally, issues like water, climate change and disaster risk management,
and production and consumption showed a decrease from 16.8% to 14.1%, 16.3%
to 12.4% and 10.3% to 8.7%, respectively, although these issues are among the top
sustainability issues, nationally and internationally.