

Waste Management—A Case Study in Nepal
193
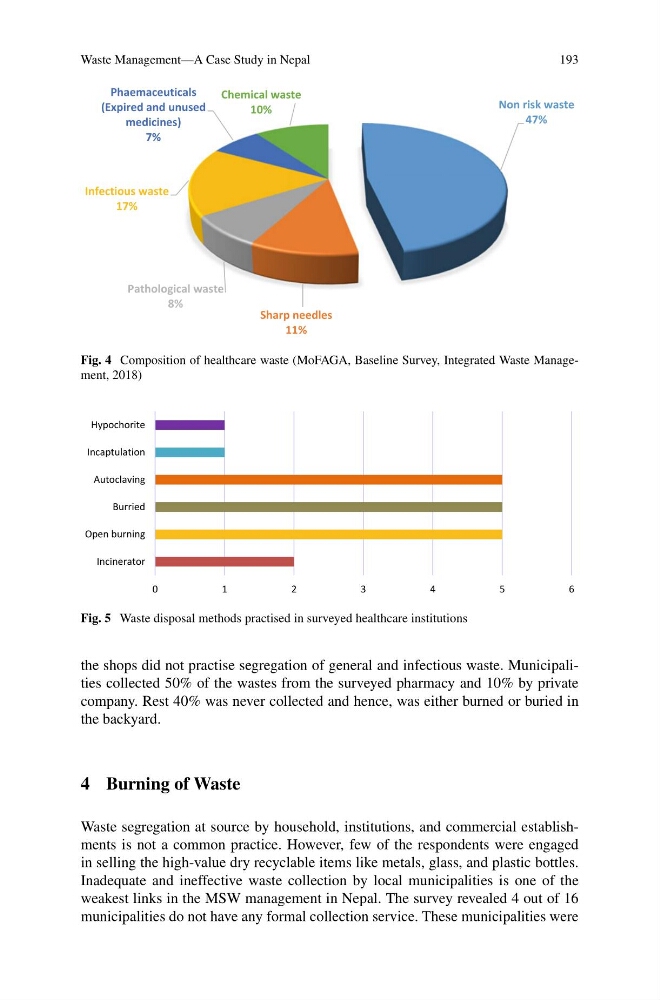
Non risk waste
47%
Sharp needles
11%
Pathological waste
8%
Infectious waste
17%
Phaemaceuticals
(Expired and unused
medicines)
7%
Chemical waste
10%
Fig. 4 Composition of healthcare waste (MoFAGA, Baseline Survey, Integrated Waste Management, 2018)
0
1
2
3
4
5
6
Incinerator
Open burning
Burried
Autoclaving
Incaptulation
Hypochorite
Fig. 5 Waste disposal methods practised in surveyed healthcare institutions
the shops did not practise segregation of general and infectious waste. Municipalities collected 50% of the wastes from the surveyed pharmacy and 10% by private
company. Rest 40% was never collected and hence, was either burned or buried in
the backyard.
4 Burning of Waste
Waste segregation at source by household, institutions, and commercial establishments is not a common practice. However, few of the respondents were engaged
in selling the high-value dry recyclable items like metals, glass, and plastic bottles.
Inadequate and ineffective waste collection by local municipalities is one of the
weakest links in the MSW management in Nepal. The survey revealed 4 out of 16
municipalities do not have any formal collection service. These municipalities were
193
Non risk waste
47%
Sharp needles
11%
Pathological waste
8%
Infectious waste
17%
Phaemaceuticals
(Expired and unused
medicines)
7%
Chemical waste
10%
Fig. 4 Composition of healthcare waste (MoFAGA, Baseline Survey, Integrated Waste Management, 2018)
0
1
2
3
4
5
6
Incinerator
Open burning
Burried
Autoclaving
Incaptulation
Hypochorite
Fig. 5 Waste disposal methods practised in surveyed healthcare institutions
the shops did not practise segregation of general and infectious waste. Municipalities collected 50% of the wastes from the surveyed pharmacy and 10% by private
company. Rest 40% was never collected and hence, was either burned or buried in
the backyard.
4 Burning of Waste
Waste segregation at source by household, institutions, and commercial establishments is not a common practice. However, few of the respondents were engaged
in selling the high-value dry recyclable items like metals, glass, and plastic bottles.
Inadequate and ineffective waste collection by local municipalities is one of the
weakest links in the MSW management in Nepal. The survey revealed 4 out of 16
municipalities do not have any formal collection service. These municipalities were