

5 Application of the Uniformly Charged Sphere Stabilization
111
Table 5.3 Average parameters and its linear deviations (×10 5 ) of the lowest 1 S resonance with
respect to the size of single-particle basis. (10th eigenvalue corresponding to R res ≈ 24–27). All
data are given in a.u.
l max
N
19
23
27
31
E res
ΔE res
E res
ΔE res
E res
ΔE res
E res
ΔE res
0
0.37453
5
0.37465
2
0.37468
0
0.37468
0
1
0.35155
25
0.35164
8
0.35167
1
0.35167
0
2
0.35115
24
0.35122
7
0.35126
1
0.35126
1
3
0.35125
1
Γ
Δ Γ
Γ
Δ Γ
Γ
Δ Γ
Γ
Δ Γ
0
0.00096
13
0.00091
3
0.00090
1
0.00090
0
1
0.00161
33
0.00178
10
0.00181
3
0.00181
0
2
0.00173
25
0.00174
9
0.00178
2
0.00177
1
3
0.00177
2
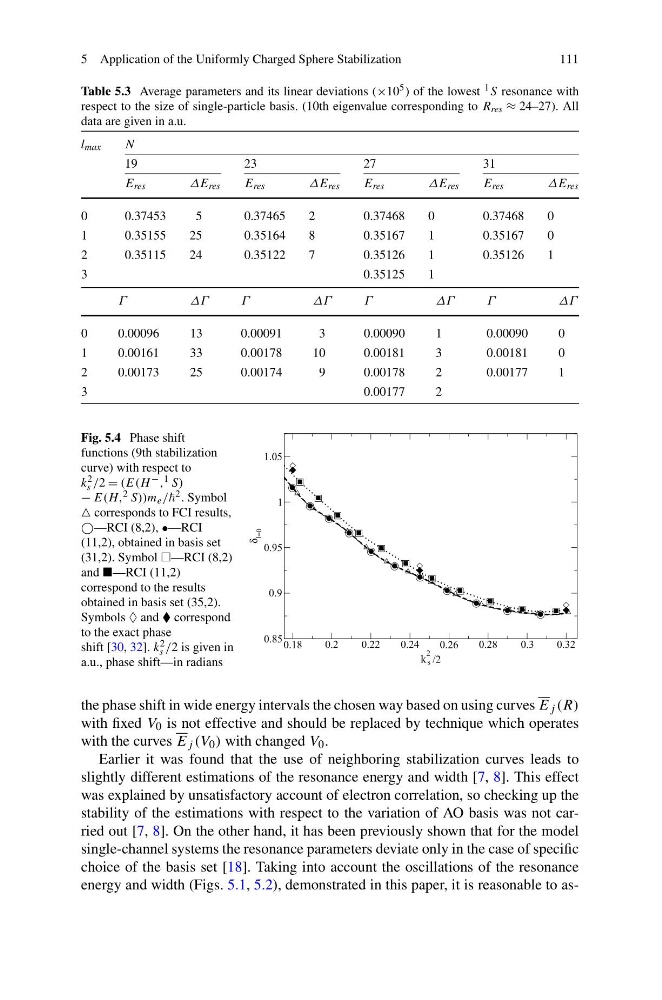
Fig. 5.4 Phase shift
functions (9th stabilization
curve) with respect to
k 2
s /2 = (E(H − , 1 S)
− E(H, 2 S))m e / 2 . Symbol
corresponds to FCI results,
—RCI (8,2), •—RCI
(11,2), obtained in basis set
(31,2). Symbol —RCI (8,2)
and —RCI (11,2)
correspond to the results
obtained in basis set (35,2).
Symbols ♦ and correspond
to the exact phase
shift [30, 32]. k 2
s /2 is given in
a.u., phase shift—in radians
the phase shift in wide energy intervals the chosen way based on using curves E j (R)
with fixed V 0 is not effective and should be replaced by technique which operates
with the curves E j (V 0 ) with changed V 0 .
Earlier it was found that the use of neighboring stabilization curves leads to
slightly different estimations of the resonance energy and width [7, 8]. This effect
was explained by unsatisfactory account of electron correlation, so checking up the
stability of the estimations with respect to the variation of AO basis was not carried out [7, 8]. On the other hand, it has been previously shown that for the model
single-channel systems the resonance parameters deviate only in the case of specific
choice of the basis set [18]. Taking into account the oscillations of the resonance
energy and width (Figs. 5.1, 5.2), demonstrated in this paper, it is reasonable to as-
111
Table 5.3 Average parameters and its linear deviations (×10 5 ) of the lowest 1 S resonance with
respect to the size of single-particle basis. (10th eigenvalue corresponding to R res ≈ 24–27). All
data are given in a.u.
l max
N
19
23
27
31
E res
ΔE res
E res
ΔE res
E res
ΔE res
E res
ΔE res
0
0.37453
5
0.37465
2
0.37468
0
0.37468
0
1
0.35155
25
0.35164
8
0.35167
1
0.35167
0
2
0.35115
24
0.35122
7
0.35126
1
0.35126
1
3
0.35125
1
Γ
Δ Γ
Γ
Δ Γ
Γ
Δ Γ
Γ
Δ Γ
0
0.00096
13
0.00091
3
0.00090
1
0.00090
0
1
0.00161
33
0.00178
10
0.00181
3
0.00181
0
2
0.00173
25
0.00174
9
0.00178
2
0.00177
1
3
0.00177
2
Fig. 5.4 Phase shift
functions (9th stabilization
curve) with respect to
k 2
s /2 = (E(H − , 1 S)
− E(H, 2 S))m e / 2 . Symbol
corresponds to FCI results,
—RCI (8,2), •—RCI
(11,2), obtained in basis set
(31,2). Symbol —RCI (8,2)
and —RCI (11,2)
correspond to the results
obtained in basis set (35,2).
Symbols ♦ and correspond
to the exact phase
shift [30, 32]. k 2
s /2 is given in
a.u., phase shift—in radians
the phase shift in wide energy intervals the chosen way based on using curves E j (R)
with fixed V 0 is not effective and should be replaced by technique which operates
with the curves E j (V 0 ) with changed V 0 .
Earlier it was found that the use of neighboring stabilization curves leads to
slightly different estimations of the resonance energy and width [7, 8]. This effect
was explained by unsatisfactory account of electron correlation, so checking up the
stability of the estimations with respect to the variation of AO basis was not carried out [7, 8]. On the other hand, it has been previously shown that for the model
single-channel systems the resonance parameters deviate only in the case of specific
choice of the basis set [18]. Taking into account the oscillations of the resonance
energy and width (Figs. 5.1, 5.2), demonstrated in this paper, it is reasonable to as-