

110
S.O. Adamson et al.
Table 5.2 Average parameters and its linear deviations (×10 5 ) of the lowest 1 S resonance with
respect to V 0 value at the same R res . All data are given in a.u.
Basis
V 0
E res
ΔE res
Γ
Δ Γ
R res
Root
(19,2)
1.0
0.35116
44
0.00151
16
30.8
11
2.0
0.35116
28
0.00188
68
32.5
10
5.0
0.35124
20
0.00176
58
31.0
9
10.0
0.35125
28
0.00172
62
32.1
9
(23,2)
1.0
0.35123
7
0.00174
28
28.8
11
2.0
0.35122
16
0.00169
20
30.6
10
5.0
0.35121
10
0.00173
32
29.7
9
10.0
0.35120
12
0.00172
36
30.8
9
(27,2)
1.0
0.35123
2
0.00176
6
28.3
11
2.0
0.35123
5
0.00176
12
30.0
10
5.0
0.35124
4
0.00175
11
28.9
9
10.0
0.35123
7
0.00174
13
29.7
9
(31,2)
1.0
0.35123
1
0.00175
1
28.3
11
2.0
0.35123
1
0.00175
4
29.7
10
5.0
0.35124
2
0.00176
4
28.7
9
10.0
0.35124
3
0.00176
8
29.6
9
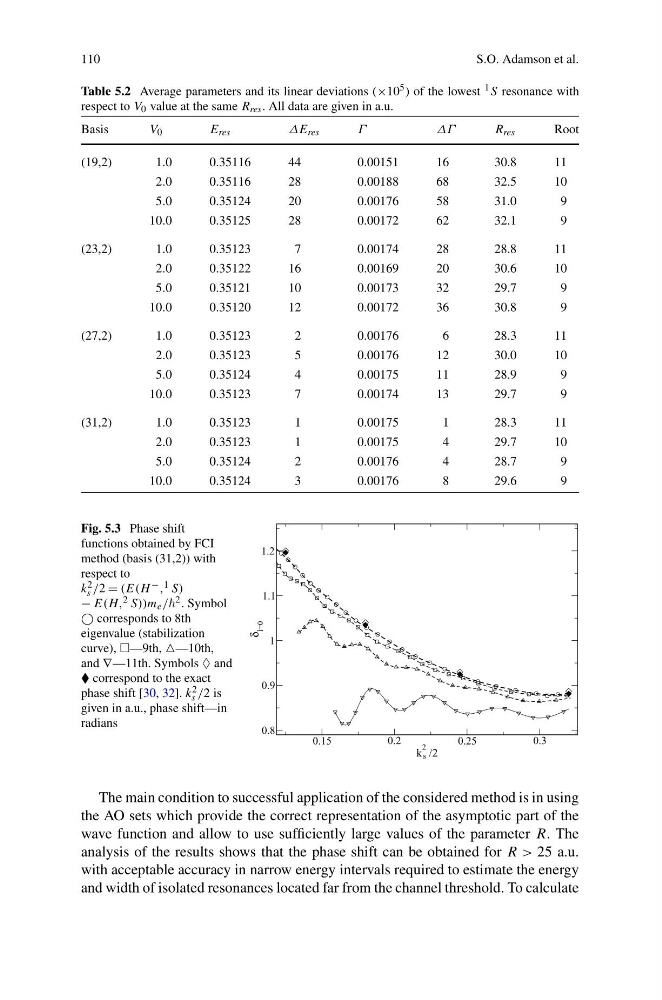
Fig. 5.3 Phase shift
functions obtained by FCI
method (basis (31,2)) with
respect to
k 2
s /2 = (E(H − , 1 S)
− E(H, 2 S))m e / 2 . Symbol
corresponds to 8th
eigenvalue (stabilization
curve), —9th, —10th,
and ∇—11th. Symbols ♦ and
correspond to the exact
phase shift [30, 32]. k 2
s /2 is
given in a.u., phase shift—in
radians
The main condition to successful application of the considered method is in using
the AO sets which provide the correct representation of the asymptotic part of the
wave function and allow to use sufficiently large values of the parameter R. The
analysis of the results shows that the phase shift can be obtained for R > 25 a.u.
with acceptable accuracy in narrow energy intervals required to estimate the energy
and width of isolated resonances located far from the channel threshold. To calculate
S.O. Adamson et al.
Table 5.2 Average parameters and its linear deviations (×10 5 ) of the lowest 1 S resonance with
respect to V 0 value at the same R res . All data are given in a.u.
Basis
V 0
E res
ΔE res
Γ
Δ Γ
R res
Root
(19,2)
1.0
0.35116
44
0.00151
16
30.8
11
2.0
0.35116
28
0.00188
68
32.5
10
5.0
0.35124
20
0.00176
58
31.0
9
10.0
0.35125
28
0.00172
62
32.1
9
(23,2)
1.0
0.35123
7
0.00174
28
28.8
11
2.0
0.35122
16
0.00169
20
30.6
10
5.0
0.35121
10
0.00173
32
29.7
9
10.0
0.35120
12
0.00172
36
30.8
9
(27,2)
1.0
0.35123
2
0.00176
6
28.3
11
2.0
0.35123
5
0.00176
12
30.0
10
5.0
0.35124
4
0.00175
11
28.9
9
10.0
0.35123
7
0.00174
13
29.7
9
(31,2)
1.0
0.35123
1
0.00175
1
28.3
11
2.0
0.35123
1
0.00175
4
29.7
10
5.0
0.35124
2
0.00176
4
28.7
9
10.0
0.35124
3
0.00176
8
29.6
9
Fig. 5.3 Phase shift
functions obtained by FCI
method (basis (31,2)) with
respect to
k 2
s /2 = (E(H − , 1 S)
− E(H, 2 S))m e / 2 . Symbol
corresponds to 8th
eigenvalue (stabilization
curve), —9th, —10th,
and ∇—11th. Symbols ♦ and
correspond to the exact
phase shift [30, 32]. k 2
s /2 is
given in a.u., phase shift—in
radians
The main condition to successful application of the considered method is in using
the AO sets which provide the correct representation of the asymptotic part of the
wave function and allow to use sufficiently large values of the parameter R. The
analysis of the results shows that the phase shift can be obtained for R > 25 a.u.
with acceptable accuracy in narrow energy intervals required to estimate the energy
and width of isolated resonances located far from the channel threshold. To calculate