

How Molecular Modelling Tools Can Help …
193
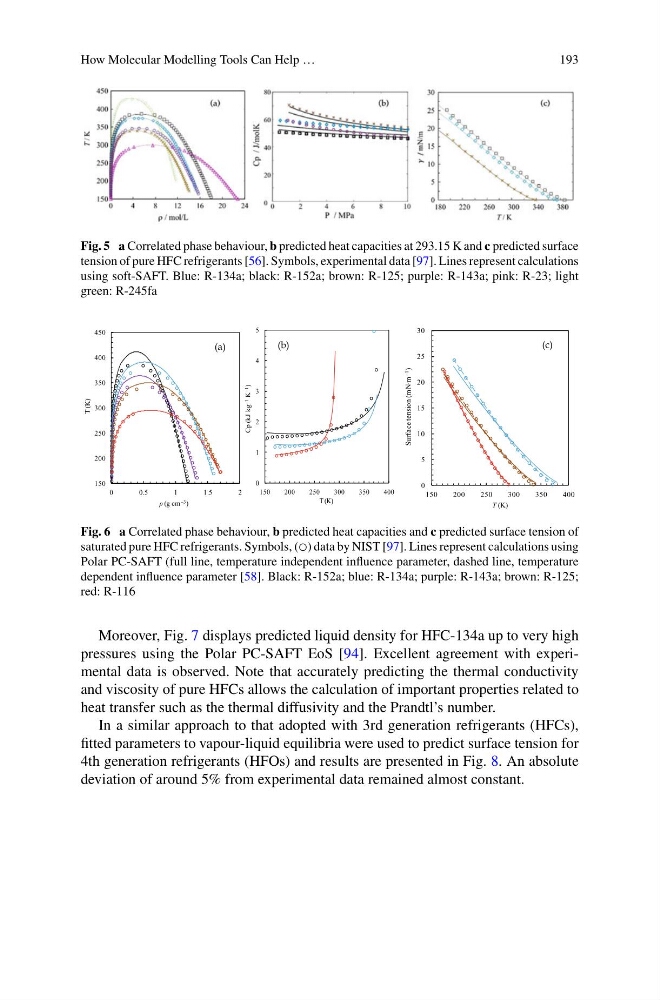
Fig. 5 a Correlated phase behaviour, b predicted heat capacities at 293.15 K and c predicted surface
tension of pure HFC refrigerants [56]. Symbols, experimental data [97]. Lines represent calculations
using soft-SAFT. Blue: R-134a; black: R-152a; brown: R-125; purple: R-143a; pink: R-23; light
green: R-245fa
Fig. 6 a Correlated phase behaviour, b predicted heat capacities and c predicted surface tension of
saturated pure HFC refrigerants. Symbols, (◯) data by NIST [97]. Lines represent calculations using
Polar PC-SAFT (full line, temperature independent influence parameter, dashed line, temperature
dependent influence parameter [58]. Black: R-152a; blue: R-134a; purple: R-143a; brown: R-125;
red: R-116
Moreover, Fig. 7 displays predicted liquid density for HFC-134a up to very high
pressures using the Polar PC-SAFT EoS [94]. Excellent agreement with experimental data is observed. Note that accurately predicting the thermal conductivity
and viscosity of pure HFCs allows the calculation of important properties related to
heat transfer such as the thermal diffusivity and the Prandtl’s number.
In a similar approach to that adopted with 3rd generation refrigerants (HFCs),
fitted parameters to vapour-liquid equilibria were used to predict surface tension for
4th generation refrigerants (HFOs) and results are presented in Fig. 8. An absolute
deviation of around 5% from experimental data remained almost constant.
193
Fig. 5 a Correlated phase behaviour, b predicted heat capacities at 293.15 K and c predicted surface
tension of pure HFC refrigerants [56]. Symbols, experimental data [97]. Lines represent calculations
using soft-SAFT. Blue: R-134a; black: R-152a; brown: R-125; purple: R-143a; pink: R-23; light
green: R-245fa
Fig. 6 a Correlated phase behaviour, b predicted heat capacities and c predicted surface tension of
saturated pure HFC refrigerants. Symbols, (◯) data by NIST [97]. Lines represent calculations using
Polar PC-SAFT (full line, temperature independent influence parameter, dashed line, temperature
dependent influence parameter [58]. Black: R-152a; blue: R-134a; purple: R-143a; brown: R-125;
red: R-116
Moreover, Fig. 7 displays predicted liquid density for HFC-134a up to very high
pressures using the Polar PC-SAFT EoS [94]. Excellent agreement with experimental data is observed. Note that accurately predicting the thermal conductivity
and viscosity of pure HFCs allows the calculation of important properties related to
heat transfer such as the thermal diffusivity and the Prandtl’s number.
In a similar approach to that adopted with 3rd generation refrigerants (HFCs),
fitted parameters to vapour-liquid equilibria were used to predict surface tension for
4th generation refrigerants (HFOs) and results are presented in Fig. 8. An absolute
deviation of around 5% from experimental data remained almost constant.