

162
H. Sun et al.
0
100
200
300
400
500
600
700
2
4
6
8
10
12
14
0.0
0.2
0.4
0.6
0.8
1.0
2
4
6
8
10
12
14
0
100
200
300
400
500
600
700
3
6
9
12
15
18
21
24
0.0
0.2
0.4
0.6
0.8
1.0
3
6
9
12
15
18
21
0
1 0 0
2 0 0
3 0 0
4 0 0
5 0 0
6 0 0
0
3
6
9
12
15
0.0
0.2
0.4
0.6
0.8
1.0
0
3
6
9
12
15
CO 2 -decane, 344.4K
Pressure (MPa)
Density (kg/m
3
)
Exp
Sim
CO 2 -decane, 344.4K
Pressure (MPa)
x CO2
Exp
Sim
Pressure (MPa)
Density (kg/m
3
)
Exp
Sim
N 2 -decane, 310K
N 2 -decane, 310K
Pressure (MPa)
x N2
Exp
Sim
Pressure (MPa)
Density (kg/cm
3 )
Exp
Sim
methane-butane, 310K
methane-butane, 310K
Pressure (MPa)
x methane
Exp
Sim
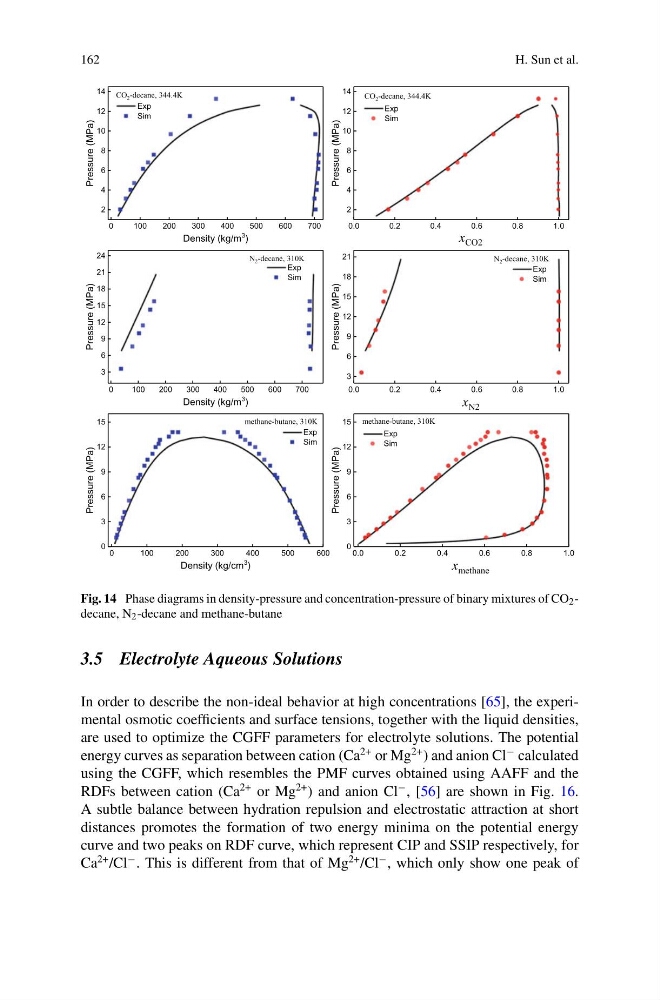
Fig. 14 Phase diagrams in density-pressure and concentration-pressure of binary mixtures of CO 2 -
decane, N 2 -decane and methane-butane
3.5 Electrolyte Aqueous Solutions
In order to describe the non-ideal behavior at high concentrations [65], the experimental osmotic coefficients and surface tensions, together with the liquid densities,
are used to optimize the CGFF parameters for electrolyte solutions. The potential
energy curves as separation between cation (Ca
2+ or Mg
2+ ) and anion Cl
− calculated
using the CGFF, which resembles the PMF curves obtained using AAFF and the
RDFs between cation (Ca
2+ or Mg
2+ ) and anion Cl
− , [56] are shown in Fig. 16.
A subtle balance between hydration repulsion and electrostatic attraction at short
distances promotes the formation of two energy minima on the potential energy
curve and two peaks on RDF curve, which represent CIP and SSIP respectively, for
Ca
2+ /Cl
− . This is different from that of Mg
2+ /Cl
− , which only show one peak of
H. Sun et al.
0
100
200
300
400
500
600
700
2
4
6
8
10
12
14
0.0
0.2
0.4
0.6
0.8
1.0
2
4
6
8
10
12
14
0
100
200
300
400
500
600
700
3
6
9
12
15
18
21
24
0.0
0.2
0.4
0.6
0.8
1.0
3
6
9
12
15
18
21
0
1 0 0
2 0 0
3 0 0
4 0 0
5 0 0
6 0 0
0
3
6
9
12
15
0.0
0.2
0.4
0.6
0.8
1.0
0
3
6
9
12
15
CO 2 -decane, 344.4K
Pressure (MPa)
Density (kg/m
3
)
Exp
Sim
CO 2 -decane, 344.4K
Pressure (MPa)
x CO2
Exp
Sim
Pressure (MPa)
Density (kg/m
3
)
Exp
Sim
N 2 -decane, 310K
N 2 -decane, 310K
Pressure (MPa)
x N2
Exp
Sim
Pressure (MPa)
Density (kg/cm
3 )
Exp
Sim
methane-butane, 310K
methane-butane, 310K
Pressure (MPa)
x methane
Exp
Sim
Fig. 14 Phase diagrams in density-pressure and concentration-pressure of binary mixtures of CO 2 -
decane, N 2 -decane and methane-butane
3.5 Electrolyte Aqueous Solutions
In order to describe the non-ideal behavior at high concentrations [65], the experimental osmotic coefficients and surface tensions, together with the liquid densities,
are used to optimize the CGFF parameters for electrolyte solutions. The potential
energy curves as separation between cation (Ca
2+ or Mg
2+ ) and anion Cl
− calculated
using the CGFF, which resembles the PMF curves obtained using AAFF and the
RDFs between cation (Ca
2+ or Mg
2+ ) and anion Cl
− , [56] are shown in Fig. 16.
A subtle balance between hydration repulsion and electrostatic attraction at short
distances promotes the formation of two energy minima on the potential energy
curve and two peaks on RDF curve, which represent CIP and SSIP respectively, for
Ca
2+ /Cl
− . This is different from that of Mg
2+ /Cl
− , which only show one peak of