

Coarse-Grained Force Fields Built on Atomistic …
161
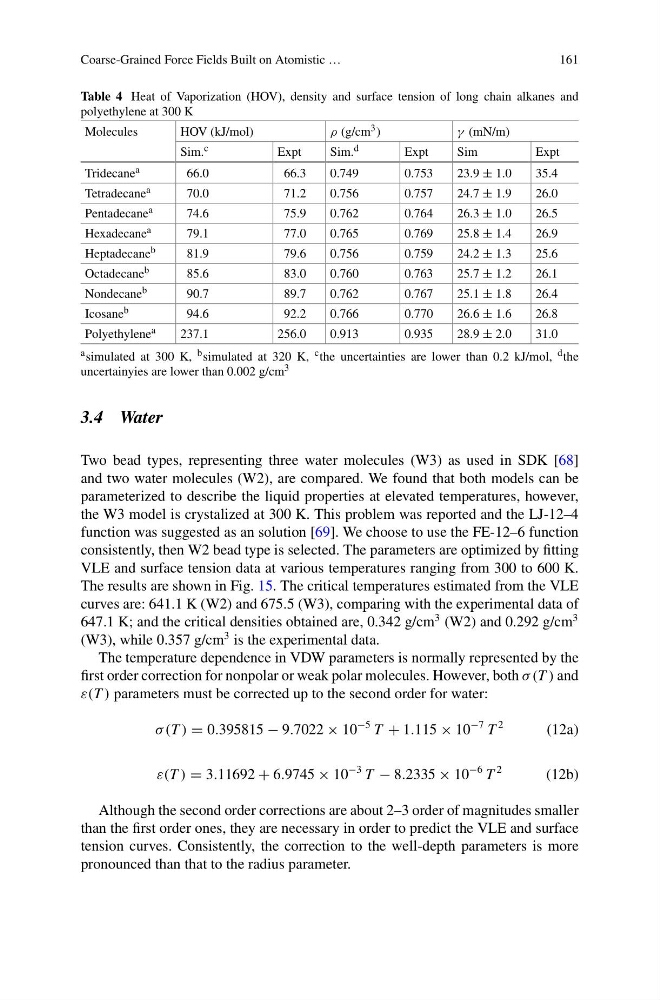
Table 4 Heat of Vaporization (HOV), density and surface tension of long chain alkanes and
polyethylene at 300 K
Molecules
HOV (kJ/mol)
ρ (g/cm 3 )
γ (mN/m)
Sim. c
Expt
Sim. d
Expt
Sim
Expt
Tridecane a
66.0
66.3
0.749
0.753
23.9 ± 1.0
35.4
Tetradecane a
70.0
71.2
0.756
0.757
24.7 ± 1.9
26.0
Pentadecane a
74.6
75.9
0.762
0.764
26.3 ± 1.0
26.5
Hexadecane a
79.1
77.0
0.765
0.769
25.8 ± 1.4
26.9
Heptadecane b
81.9
79.6
0.756
0.759
24.2 ± 1.3
25.6
Octadecane b
85.6
83.0
0.760
0.763
25.7 ± 1.2
26.1
Nondecane b
90.7
89.7
0.762
0.767
25.1 ± 1.8
26.4
Icosane b
94.6
92.2
0.766
0.770
26.6 ± 1.6
26.8
Polyethylene a
237.1
256.0
0.913
0.935
28.9 ± 2.0
31.0
a simulated at 300 K, b simulated at 320 K, c the uncertainties are lower than 0.2 kJ/mol, d the
uncertainyies are lower than 0.002 g/cm 3
3.4 Water
Two bead types, representing three water molecules (W3) as used in SDK [68]
and two water molecules (W2), are compared. We found that both models can be
parameterized to describe the liquid properties at elevated temperatures, however,
the W3 model is crystalized at 300 K. This problem was reported and the LJ-12–4
function was suggested as an solution [69]. We choose to use the FE-12–6 function
consistently, then W2 bead type is selected. The parameters are optimized by fitting
VLE and surface tension data at various temperatures ranging from 300 to 600 K.
The results are shown in Fig. 15. The critical temperatures estimated from the VLE
curves are: 641.1 K (W2) and 675.5 (W3), comparing with the experimental data of
647.1 K; and the critical densities obtained are, 0.342 g/cm
3 (W2) and 0.292 g/cm
3
(W3), while 0.357 g/cm
3 is the experimental data.
The temperature dependence in VDW parameters is normally represented by the
first order correction for nonpolar or weak polar molecules. However, both σ (T ) and
ε(T ) parameters must be corrected up to the second order for water:
σ (T ) = 0.395815 − 9.7022 × 10
−5 T + 1.115 × 10
−7 T
2
(12a)
ε(T ) = 3.11692 + 6.9745 × 10
−3 T − 8.2335 × 10
−6 T
2
(12b)
Although the second order corrections are about 2–3 order of magnitudes smaller
than the first order ones, they are necessary in order to predict the VLE and surface
tension curves. Consistently, the correction to the well-depth parameters is more
pronounced than that to the radius parameter.
161
Table 4 Heat of Vaporization (HOV), density and surface tension of long chain alkanes and
polyethylene at 300 K
Molecules
HOV (kJ/mol)
ρ (g/cm 3 )
γ (mN/m)
Sim. c
Expt
Sim. d
Expt
Sim
Expt
Tridecane a
66.0
66.3
0.749
0.753
23.9 ± 1.0
35.4
Tetradecane a
70.0
71.2
0.756
0.757
24.7 ± 1.9
26.0
Pentadecane a
74.6
75.9
0.762
0.764
26.3 ± 1.0
26.5
Hexadecane a
79.1
77.0
0.765
0.769
25.8 ± 1.4
26.9
Heptadecane b
81.9
79.6
0.756
0.759
24.2 ± 1.3
25.6
Octadecane b
85.6
83.0
0.760
0.763
25.7 ± 1.2
26.1
Nondecane b
90.7
89.7
0.762
0.767
25.1 ± 1.8
26.4
Icosane b
94.6
92.2
0.766
0.770
26.6 ± 1.6
26.8
Polyethylene a
237.1
256.0
0.913
0.935
28.9 ± 2.0
31.0
a simulated at 300 K, b simulated at 320 K, c the uncertainties are lower than 0.2 kJ/mol, d the
uncertainyies are lower than 0.002 g/cm 3
3.4 Water
Two bead types, representing three water molecules (W3) as used in SDK [68]
and two water molecules (W2), are compared. We found that both models can be
parameterized to describe the liquid properties at elevated temperatures, however,
the W3 model is crystalized at 300 K. This problem was reported and the LJ-12–4
function was suggested as an solution [69]. We choose to use the FE-12–6 function
consistently, then W2 bead type is selected. The parameters are optimized by fitting
VLE and surface tension data at various temperatures ranging from 300 to 600 K.
The results are shown in Fig. 15. The critical temperatures estimated from the VLE
curves are: 641.1 K (W2) and 675.5 (W3), comparing with the experimental data of
647.1 K; and the critical densities obtained are, 0.342 g/cm
3 (W2) and 0.292 g/cm
3
(W3), while 0.357 g/cm
3 is the experimental data.
The temperature dependence in VDW parameters is normally represented by the
first order correction for nonpolar or weak polar molecules. However, both σ (T ) and
ε(T ) parameters must be corrected up to the second order for water:
σ (T ) = 0.395815 − 9.7022 × 10
−5 T + 1.115 × 10
−7 T
2
(12a)
ε(T ) = 3.11692 + 6.9745 × 10
−3 T − 8.2335 × 10
−6 T
2
(12b)
Although the second order corrections are about 2–3 order of magnitudes smaller
than the first order ones, they are necessary in order to predict the VLE and surface
tension curves. Consistently, the correction to the well-depth parameters is more
pronounced than that to the radius parameter.