

Efficient Sampling of High-Dimensional …
133
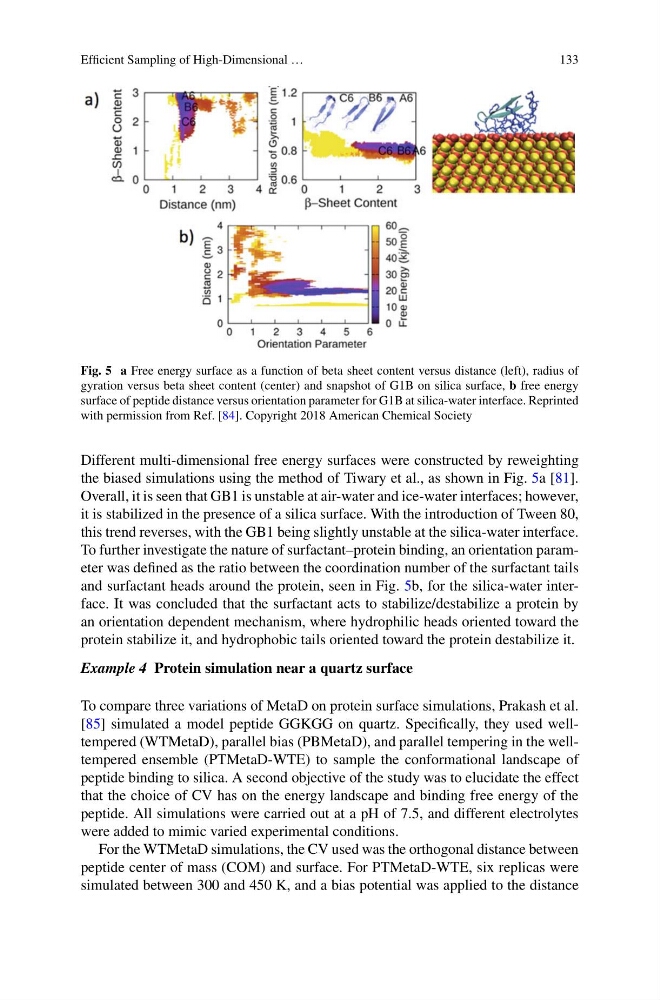
Fig. 5 a Free energy surface as a function of beta sheet content versus distance (left), radius of
gyration versus beta sheet content (center) and snapshot of G1B on silica surface, b free energy
surface of peptide distance versus orientation parameter for G1B at silica-water interface. Reprinted
with permission from Ref. [84]. Copyright 2018 American Chemical Society
Different multi-dimensional free energy surfaces were constructed by reweighting
the biased simulations using the method of Tiwary et al., as shown in Fig. 5a [81].
Overall, it is seen that GB1 is unstable at air-water and ice-water interfaces; however,
it is stabilized in the presence of a silica surface. With the introduction of Tween 80,
this trend reverses, with the GB1 being slightly unstable at the silica-water interface.
To further investigate the nature of surfactant–protein binding, an orientation parameter was defined as the ratio between the coordination number of the surfactant tails
and surfactant heads around the protein, seen in Fig. 5b, for the silica-water interface. It was concluded that the surfactant acts to stabilize/destabilize a protein by
an orientation dependent mechanism, where hydrophilic heads oriented toward the
protein stabilize it, and hydrophobic tails oriented toward the protein destabilize it.
Example 4 Protein simulation near a quartz surface
To compare three variations of MetaD on protein surface simulations, Prakash et al.
[85] simulated a model peptide GGKGG on quartz. Specifically, they used welltempered (WTMetaD), parallel bias (PBMetaD), and parallel tempering in the welltempered ensemble (PTMetaD-WTE) to sample the conformational landscape of
peptide binding to silica. A second objective of the study was to elucidate the effect
that the choice of CV has on the energy landscape and binding free energy of the
peptide. All simulations were carried out at a pH of 7.5, and different electrolytes
were added to mimic varied experimental conditions.
For the WTMetaD simulations, the CV used was the orthogonal distance between
peptide center of mass (COM) and surface. For PTMetaD-WTE, six replicas were
simulated between 300 and 450 K, and a bias potential was applied to the distance
133
Fig. 5 a Free energy surface as a function of beta sheet content versus distance (left), radius of
gyration versus beta sheet content (center) and snapshot of G1B on silica surface, b free energy
surface of peptide distance versus orientation parameter for G1B at silica-water interface. Reprinted
with permission from Ref. [84]. Copyright 2018 American Chemical Society
Different multi-dimensional free energy surfaces were constructed by reweighting
the biased simulations using the method of Tiwary et al., as shown in Fig. 5a [81].
Overall, it is seen that GB1 is unstable at air-water and ice-water interfaces; however,
it is stabilized in the presence of a silica surface. With the introduction of Tween 80,
this trend reverses, with the GB1 being slightly unstable at the silica-water interface.
To further investigate the nature of surfactant–protein binding, an orientation parameter was defined as the ratio between the coordination number of the surfactant tails
and surfactant heads around the protein, seen in Fig. 5b, for the silica-water interface. It was concluded that the surfactant acts to stabilize/destabilize a protein by
an orientation dependent mechanism, where hydrophilic heads oriented toward the
protein stabilize it, and hydrophobic tails oriented toward the protein destabilize it.
Example 4 Protein simulation near a quartz surface
To compare three variations of MetaD on protein surface simulations, Prakash et al.
[85] simulated a model peptide GGKGG on quartz. Specifically, they used welltempered (WTMetaD), parallel bias (PBMetaD), and parallel tempering in the welltempered ensemble (PTMetaD-WTE) to sample the conformational landscape of
peptide binding to silica. A second objective of the study was to elucidate the effect
that the choice of CV has on the energy landscape and binding free energy of the
peptide. All simulations were carried out at a pH of 7.5, and different electrolytes
were added to mimic varied experimental conditions.
For the WTMetaD simulations, the CV used was the orthogonal distance between
peptide center of mass (COM) and surface. For PTMetaD-WTE, six replicas were
simulated between 300 and 450 K, and a bias potential was applied to the distance