

134
S. Alamdari et al.
between the COM of the peptide and the surface. In contrast to the methods above,
two CVs were applied for the PBMetaD simulations, namely (1) z-component of the
distance of each ion from the surface and (2) distance of the COM of the peptide
from the surface.
Based on the type of electrolytic solution used, the authors evaluated the efficiency
of the methods based on peptide binding free energy profile and convergence of the
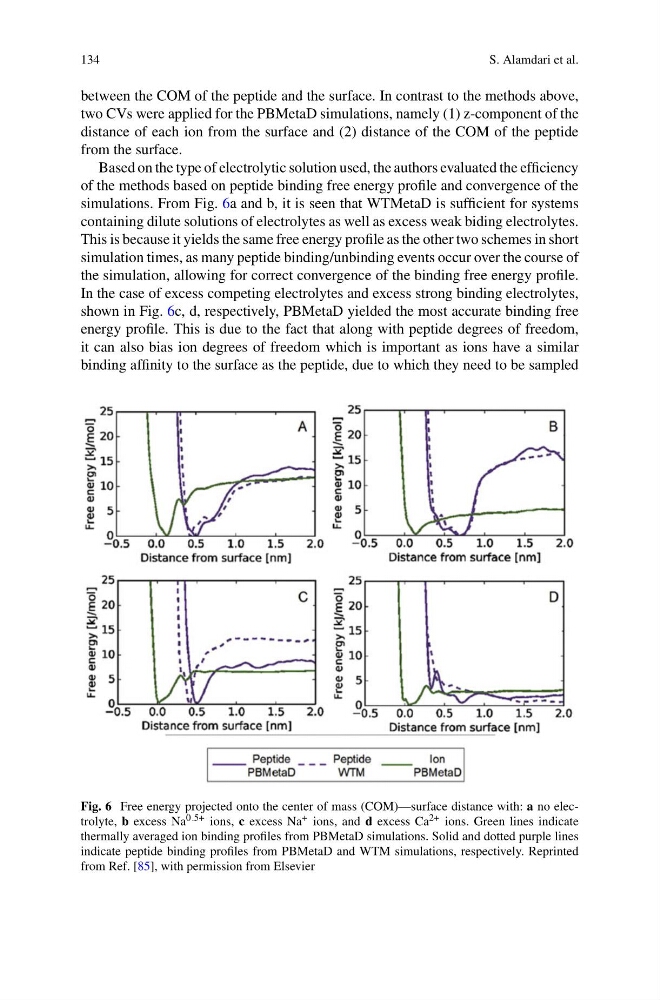
simulations. From Fig. 6a and b, it is seen that WTMetaD is sufficient for systems
containing dilute solutions of electrolytes as well as excess weak biding electrolytes.
This is because it yields the same free energy profile as the other two schemes in short
simulation times, as many peptide binding/unbinding events occur over the course of
the simulation, allowing for correct convergence of the binding free energy profile.
In the case of excess competing electrolytes and excess strong binding electrolytes,
shown in Fig. 6c, d, respectively, PBMetaD yielded the most accurate binding free
energy profile. This is due to the fact that along with peptide degrees of freedom,
it can also bias ion degrees of freedom which is important as ions have a similar
binding affinity to the surface as the peptide, due to which they need to be sampled
Fig. 6 Free energy projected onto the center of mass (COM)—surface distance with: a no electrolyte, b excess Na 0.5+ ions, c excess Na + ions, and d excess Ca 2+ ions. Green lines indicate
thermally averaged ion binding profiles from PBMetaD simulations. Solid and dotted purple lines
indicate peptide binding profiles from PBMetaD and WTM simulations, respectively. Reprinted
from Ref. [85], with permission from Elsevier
S. Alamdari et al.
between the COM of the peptide and the surface. In contrast to the methods above,
two CVs were applied for the PBMetaD simulations, namely (1) z-component of the
distance of each ion from the surface and (2) distance of the COM of the peptide
from the surface.
Based on the type of electrolytic solution used, the authors evaluated the efficiency
of the methods based on peptide binding free energy profile and convergence of the
simulations. From Fig. 6a and b, it is seen that WTMetaD is sufficient for systems
containing dilute solutions of electrolytes as well as excess weak biding electrolytes.
This is because it yields the same free energy profile as the other two schemes in short
simulation times, as many peptide binding/unbinding events occur over the course of
the simulation, allowing for correct convergence of the binding free energy profile.
In the case of excess competing electrolytes and excess strong binding electrolytes,
shown in Fig. 6c, d, respectively, PBMetaD yielded the most accurate binding free
energy profile. This is due to the fact that along with peptide degrees of freedom,
it can also bias ion degrees of freedom which is important as ions have a similar
binding affinity to the surface as the peptide, due to which they need to be sampled
Fig. 6 Free energy projected onto the center of mass (COM)—surface distance with: a no electrolyte, b excess Na 0.5+ ions, c excess Na + ions, and d excess Ca 2+ ions. Green lines indicate
thermally averaged ion binding profiles from PBMetaD simulations. Solid and dotted purple lines
indicate peptide binding profiles from PBMetaD and WTM simulations, respectively. Reprinted
from Ref. [85], with permission from Elsevier