

112
E. O. Fetisov et al.
Please note that, in accord with Wallace et al. [35], the vibrational partition function
of CO
2−
3 is not considered and only a reduced rovibrational partition function of the
aggregates is included as the sampling treats the CO
2−
3 anion as a point particle.
Using the equilibrium constants defined in Eq. (3), we can obtain the absolute
free energies of CaCO 3 clusters using Eq. (4) that are referenced to the monomer
(CaCO 3 ion pair) free energy, G (i 1 ,i 2 ) = g (i 1 ,i 2 ) − (i 1 + i 2 )g (1,1) , and directly compare our reduced model results to the values obtained by Wallace et al. [35] using the
all-atom interaction potential in the presence of explicit water [24]. One important
point should be emphasized, however. Originally, the reported values of G (i 1 ,i 2 ) were
confused with the reversible work of formation, and supersaturated CaCO 3 solutions were believed to spinodally decompose due to monotonically decreasing free
energies as mentioned in the previous discussion. However, there is a clear difference between absolute free energies and free energies of formation (i.e., reversible
work of formation), which has to be referenced to a monomer chemical potential
as well as solution supersaturation. That is, the reversible work of cluster formation
depends strongly on concentration, whereas the absolute cluster free energies depend
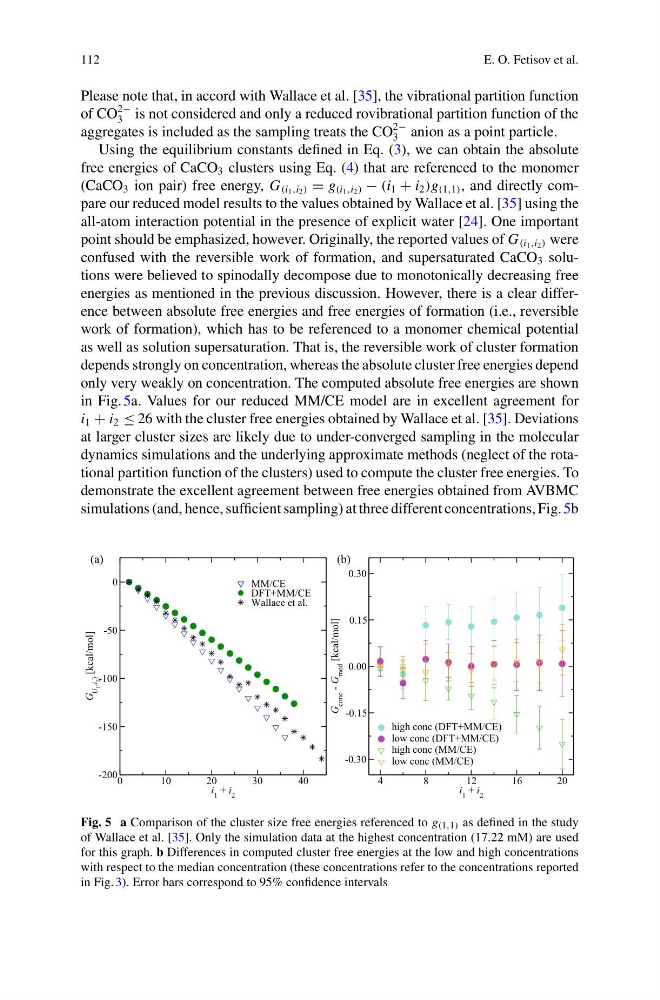
only very weakly on concentration. The computed absolute free energies are shown
in Fig. 5a. Values for our reduced MM/CE model are in excellent agreement for
i 1 + i 2 ≤ 26 with the cluster free energies obtained by Wallace et al. [35]. Deviations
at larger cluster sizes are likely due to under-converged sampling in the molecular
dynamics simulations and the underlying approximate methods (neglect of the rotational partition function of the clusters) used to compute the cluster free energies. To
demonstrate the excellent agreement between free energies obtained from AVBMC
simulations (and, hence, sufficient sampling) at three different concentrations, Fig. 5b
0
1 0
2 0
3 0
4 0
i 1 + i 2
-200
-150
-100
-50
0
G
(i
1
,i
2
)
[kcal/mol]
MM/CE
DFT+MM/CE
Wallace et al.
4
8
12
16
20
i 1 + i 2
-0.30
-0.15
0.00
0.15
0.30
G
conc
-
G
med
[kcal/mol]
high conc (DFT+MM/CE)
low conc (DFT+MM/CE)
high conc (MM/CE)
low conc (MM/CE)
(a)
(b)
Fig. 5 a Comparison of the cluster size free energies referenced to g (1,1) as defined in the study
of Wallace et al. [35]. Only the simulation data at the highest concentration (17.22 mM) are used
for this graph. b Differences in computed cluster free energies at the low and high concentrations
with respect to the median concentration (these concentrations refer to the concentrations reported
in Fig. 3). Error bars correspond to 95% confidence intervals
E. O. Fetisov et al.
Please note that, in accord with Wallace et al. [35], the vibrational partition function
of CO
2−
3 is not considered and only a reduced rovibrational partition function of the
aggregates is included as the sampling treats the CO
2−
3 anion as a point particle.
Using the equilibrium constants defined in Eq. (3), we can obtain the absolute
free energies of CaCO 3 clusters using Eq. (4) that are referenced to the monomer
(CaCO 3 ion pair) free energy, G (i 1 ,i 2 ) = g (i 1 ,i 2 ) − (i 1 + i 2 )g (1,1) , and directly compare our reduced model results to the values obtained by Wallace et al. [35] using the
all-atom interaction potential in the presence of explicit water [24]. One important
point should be emphasized, however. Originally, the reported values of G (i 1 ,i 2 ) were
confused with the reversible work of formation, and supersaturated CaCO 3 solutions were believed to spinodally decompose due to monotonically decreasing free
energies as mentioned in the previous discussion. However, there is a clear difference between absolute free energies and free energies of formation (i.e., reversible
work of formation), which has to be referenced to a monomer chemical potential
as well as solution supersaturation. That is, the reversible work of cluster formation
depends strongly on concentration, whereas the absolute cluster free energies depend
only very weakly on concentration. The computed absolute free energies are shown
in Fig. 5a. Values for our reduced MM/CE model are in excellent agreement for
i 1 + i 2 ≤ 26 with the cluster free energies obtained by Wallace et al. [35]. Deviations
at larger cluster sizes are likely due to under-converged sampling in the molecular
dynamics simulations and the underlying approximate methods (neglect of the rotational partition function of the clusters) used to compute the cluster free energies. To
demonstrate the excellent agreement between free energies obtained from AVBMC
simulations (and, hence, sufficient sampling) at three different concentrations, Fig. 5b
0
1 0
2 0
3 0
4 0
i 1 + i 2
-200
-150
-100
-50
0
G
(i
1
,i
2
)
[kcal/mol]
MM/CE
DFT+MM/CE
Wallace et al.
4
8
12
16
20
i 1 + i 2
-0.30
-0.15
0.00
0.15
0.30
G
conc
-
G
med
[kcal/mol]
high conc (DFT+MM/CE)
low conc (DFT+MM/CE)
high conc (MM/CE)
low conc (MM/CE)
(a)
(b)
Fig. 5 a Comparison of the cluster size free energies referenced to g (1,1) as defined in the study
of Wallace et al. [35]. Only the simulation data at the highest concentration (17.22 mM) are used
for this graph. b Differences in computed cluster free energies at the low and high concentrations
with respect to the median concentration (these concentrations refer to the concentrations reported
in Fig. 3). Error bars correspond to 95% confidence intervals