

Studies on Recycled Polyester
47
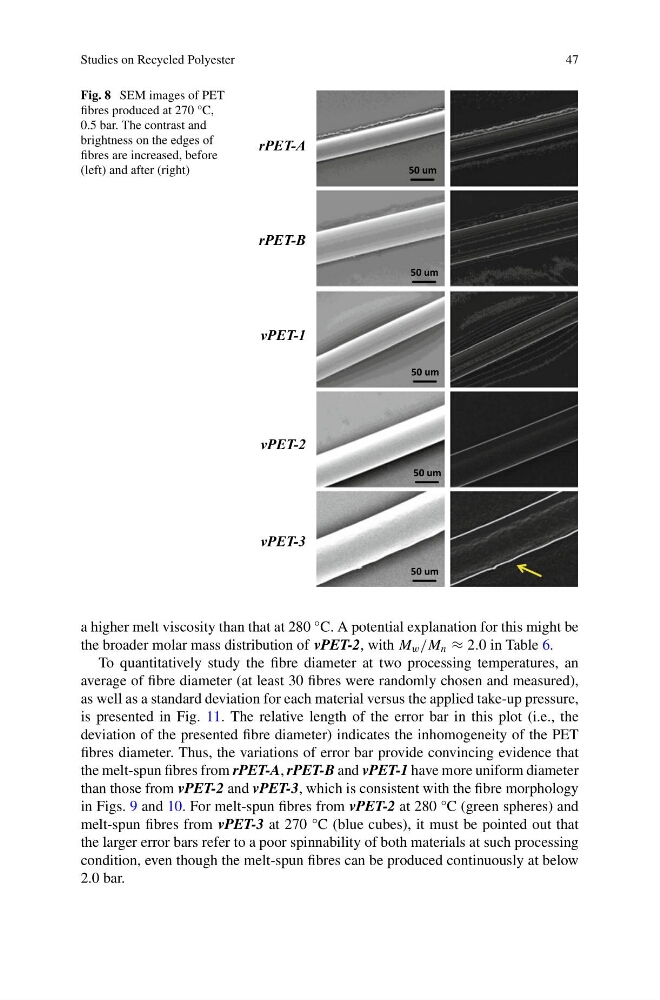
Fig. 8 SEM images of PET
fibres produced at 270 °C,
0.5 bar. The contrast and
brightness on the edges of
fibres are increased, before
(left) and after (right)
rPET-A
rPET-B
vPET-2
vPET-1
vPET-3
50 um
50 um
50 um
50 um
50 um
a higher melt viscosity than that at 280 °C. A potential explanation for this might be
the broader molar mass distribution of vPET-2, with M w /M n ≈ 2.0 in Table 6.
To quantitatively study the fibre diameter at two processing temperatures, an
average of fibre diameter (at least 30 fibres were randomly chosen and measured),
as well as a standard deviation for each material versus the applied take-up pressure,
is presented in Fig. 11. The relative length of the error bar in this plot (i.e., the
deviation of the presented fibre diameter) indicates the inhomogeneity of the PET
fibres diameter. Thus, the variations of error bar provide convincing evidence that
the melt-spun fibres from rPET-A, rPET-B and vPET-1 have more uniform diameter
than those from vPET-2 and vPET-3, which is consistent with the fibre morphology
in Figs. 9 and 10. For melt-spun fibres from vPET-2 at 280 °C (green spheres) and
melt-spun fibres from vPET-3 at 270 °C (blue cubes), it must be pointed out that
the larger error bars refer to a poor spinnability of both materials at such processing
condition, even though the melt-spun fibres can be produced continuously at below
2.0 bar.
47
Fig. 8 SEM images of PET
fibres produced at 270 °C,
0.5 bar. The contrast and
brightness on the edges of
fibres are increased, before
(left) and after (right)
rPET-A
rPET-B
vPET-2
vPET-1
vPET-3
50 um
50 um
50 um
50 um
50 um
a higher melt viscosity than that at 280 °C. A potential explanation for this might be
the broader molar mass distribution of vPET-2, with M w /M n ≈ 2.0 in Table 6.
To quantitatively study the fibre diameter at two processing temperatures, an
average of fibre diameter (at least 30 fibres were randomly chosen and measured),
as well as a standard deviation for each material versus the applied take-up pressure,
is presented in Fig. 11. The relative length of the error bar in this plot (i.e., the
deviation of the presented fibre diameter) indicates the inhomogeneity of the PET
fibres diameter. Thus, the variations of error bar provide convincing evidence that
the melt-spun fibres from rPET-A, rPET-B and vPET-1 have more uniform diameter
than those from vPET-2 and vPET-3, which is consistent with the fibre morphology
in Figs. 9 and 10. For melt-spun fibres from vPET-2 at 280 °C (green spheres) and
melt-spun fibres from vPET-3 at 270 °C (blue cubes), it must be pointed out that
the larger error bars refer to a poor spinnability of both materials at such processing
condition, even though the melt-spun fibres can be produced continuously at below
2.0 bar.