

40
Y. Qin et al.
addition of pigment could influence the crystallization behaviour of PET to some
degree. The data derived from the second heating scan of all the investigated PET
materials are summarized in Table 4. As reported that the glass transition temperature
T g , especially the melting temperature T m2 of vPET-1 and vPET-3 were higher than
those of other PET polymers, which was expected due to the difference between
homo-polymers (vPET-1 and vPET-3) and co-polymers. This is because the random
sequence of the co-monomeric units in co-polymers would destroy the crystalline
lattice compared with the homo-polymers, and thus less ordered, unstable structures
are formed [42]. Consequently, the disordered and unstable structures lead to the
lower melting temperature of co-polymers.
It can also be found that the first melting peak (T m1 ) is about 10 °C lower than the
second melting peak (T m2 ), where the appearance of T m1 is documented to be more
likely concerning to the lower lamellae thickness and more imperfection of crystals
[43]. Instead, the appearance of a single sharp melting peak in the thermograms, for
instance, vPET-3 in Fig. 2c, indicates comparatively perfect crystalline structures and
a higher lamellae thickness. In addition, with respect to some of the specimens, like
the clear flake in rPET-A, a recrystallization peak can be observed at 153–165 °C.
The crystallinity X c was calculated by Eq. (7) and listed in Table 5 as well. Overall,
the crystallinity X c of all the materials is lower than 25%. There was a slight increase
of crystallinity X c in coloured flakes compared with the clear ones in rPET-A and
rPET-B.
3.2 Molar Mass Characterization
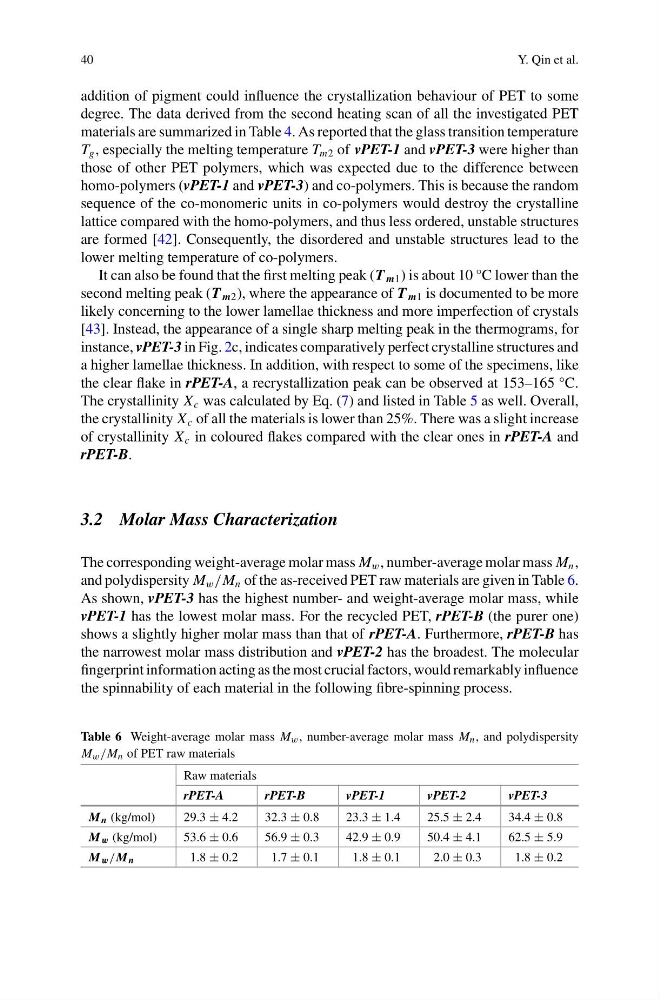
The corresponding weight-average molar mass M w , number-average molar mass M n ,
and polydispersity M w /M n of the as-received PET raw materials are given in Table 6.
As shown, vPET-3 has the highest number- and weight-average molar mass, while
vPET-1 has the lowest molar mass. For the recycled PET, rPET-B (the purer one)
shows a slightly higher molar mass than that of rPET-A. Furthermore, rPET-B has
the narrowest molar mass distribution and vPET-2 has the broadest. The molecular
fingerprint information acting as the most crucial factors, would remarkably influence
the spinnability of each material in the following fibre-spinning process.
Table 6 Weight-average molar mass M w , number-average molar mass M n , and polydispersity
M w /M n of PET raw materials
Raw materials
rPET-A
rPET-B
vPET-1
vPET-2
vPET-3
M n (kg/mol)
29.3 ± 4.2
32.3 ± 0.8
23.3 ± 1.4
25.5 ± 2.4
34.4 ± 0.8
M w (kg/mol)
53.6 ± 0.6
56.9 ± 0.3
42.9 ± 0.9
50.4 ± 4.1
62.5 ± 5.9
M w /M n
1.8 ± 0.2
1.7 ± 0.1
1.8 ± 0.1
2.0 ± 0.3
1.8 ± 0.2
Y. Qin et al.
addition of pigment could influence the crystallization behaviour of PET to some
degree. The data derived from the second heating scan of all the investigated PET
materials are summarized in Table 4. As reported that the glass transition temperature
T g , especially the melting temperature T m2 of vPET-1 and vPET-3 were higher than
those of other PET polymers, which was expected due to the difference between
homo-polymers (vPET-1 and vPET-3) and co-polymers. This is because the random
sequence of the co-monomeric units in co-polymers would destroy the crystalline
lattice compared with the homo-polymers, and thus less ordered, unstable structures
are formed [42]. Consequently, the disordered and unstable structures lead to the
lower melting temperature of co-polymers.
It can also be found that the first melting peak (T m1 ) is about 10 °C lower than the
second melting peak (T m2 ), where the appearance of T m1 is documented to be more
likely concerning to the lower lamellae thickness and more imperfection of crystals
[43]. Instead, the appearance of a single sharp melting peak in the thermograms, for
instance, vPET-3 in Fig. 2c, indicates comparatively perfect crystalline structures and
a higher lamellae thickness. In addition, with respect to some of the specimens, like
the clear flake in rPET-A, a recrystallization peak can be observed at 153–165 °C.
The crystallinity X c was calculated by Eq. (7) and listed in Table 5 as well. Overall,
the crystallinity X c of all the materials is lower than 25%. There was a slight increase
of crystallinity X c in coloured flakes compared with the clear ones in rPET-A and
rPET-B.
3.2 Molar Mass Characterization
The corresponding weight-average molar mass M w , number-average molar mass M n ,
and polydispersity M w /M n of the as-received PET raw materials are given in Table 6.
As shown, vPET-3 has the highest number- and weight-average molar mass, while
vPET-1 has the lowest molar mass. For the recycled PET, rPET-B (the purer one)
shows a slightly higher molar mass than that of rPET-A. Furthermore, rPET-B has
the narrowest molar mass distribution and vPET-2 has the broadest. The molecular
fingerprint information acting as the most crucial factors, would remarkably influence
the spinnability of each material in the following fibre-spinning process.
Table 6 Weight-average molar mass M w , number-average molar mass M n , and polydispersity
M w /M n of PET raw materials
Raw materials
rPET-A
rPET-B
vPET-1
vPET-2
vPET-3
M n (kg/mol)
29.3 ± 4.2
32.3 ± 0.8
23.3 ± 1.4
25.5 ± 2.4
34.4 ± 0.8
M w (kg/mol)
53.6 ± 0.6
56.9 ± 0.3
42.9 ± 0.9
50.4 ± 4.1
62.5 ± 5.9
M w /M n
1.8 ± 0.2
1.7 ± 0.1
1.8 ± 0.1
2.0 ± 0.3
1.8 ± 0.2