

Studies on Recycled Polyester
39
3 Characterizations of Raw Materials
3.1 Thermal Behaviour
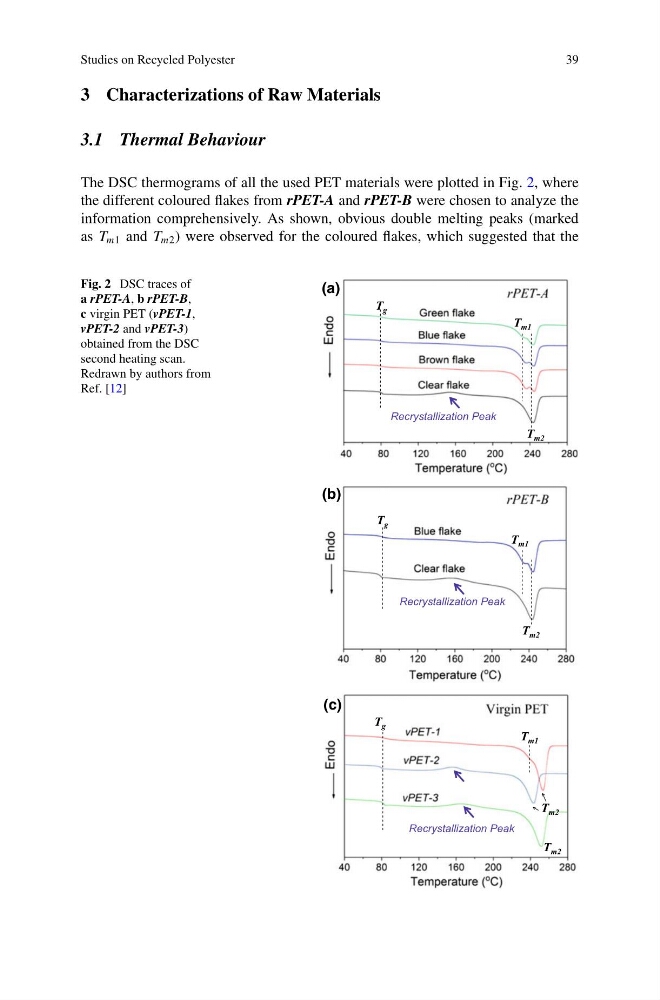
The DSC thermograms of all the used PET materials were plotted in Fig. 2, where
the different coloured flakes from rPET-A and rPET-B were chosen to analyze the
information comprehensively. As shown, obvious double melting peaks (marked
as T m1 and T m2 ) were observed for the coloured flakes, which suggested that the
Fig. 2 DSC traces of
a rPET-A, b rPET-B,
c virgin PET (vPET-1,
vPET-2 and vPET-3)
obtained from the DSC
second heating scan.
Redrawn by authors from
Ref. [12]
T m2
T m1
T m2
T m1
T g
T g
(a)
(b)
T m1
T m2
T m2
T g
(c)
Recrystallization Peak
Recrystallization Peak
Recrystallization Peak
39
3 Characterizations of Raw Materials
3.1 Thermal Behaviour
The DSC thermograms of all the used PET materials were plotted in Fig. 2, where
the different coloured flakes from rPET-A and rPET-B were chosen to analyze the
information comprehensively. As shown, obvious double melting peaks (marked
as T m1 and T m2 ) were observed for the coloured flakes, which suggested that the
Fig. 2 DSC traces of
a rPET-A, b rPET-B,
c virgin PET (vPET-1,
vPET-2 and vPET-3)
obtained from the DSC
second heating scan.
Redrawn by authors from
Ref. [12]
T m2
T m1
T m2
T m1
T g
T g
(a)
(b)
T m1
T m2
T m2
T g
(c)
Recrystallization Peak
Recrystallization Peak
Recrystallization Peak