

9 Analytical Protocols in Antioxidant Capacity Measurement
215
+S
O
O
O
O
S
O -
O
O
K +
O - K +
H 5 C 2
H 5 C 2
SO -
3
SO -
3
Stage 1
Stage 2
ABTS
(Colorless)
ABTS •+
•+
Blue-green color
K 2 S 2 O 8
Oxidation
ANTIOXIDANT +
ABTS
(Colorless)
12 to 16 hours
ABTS
Blue-green color
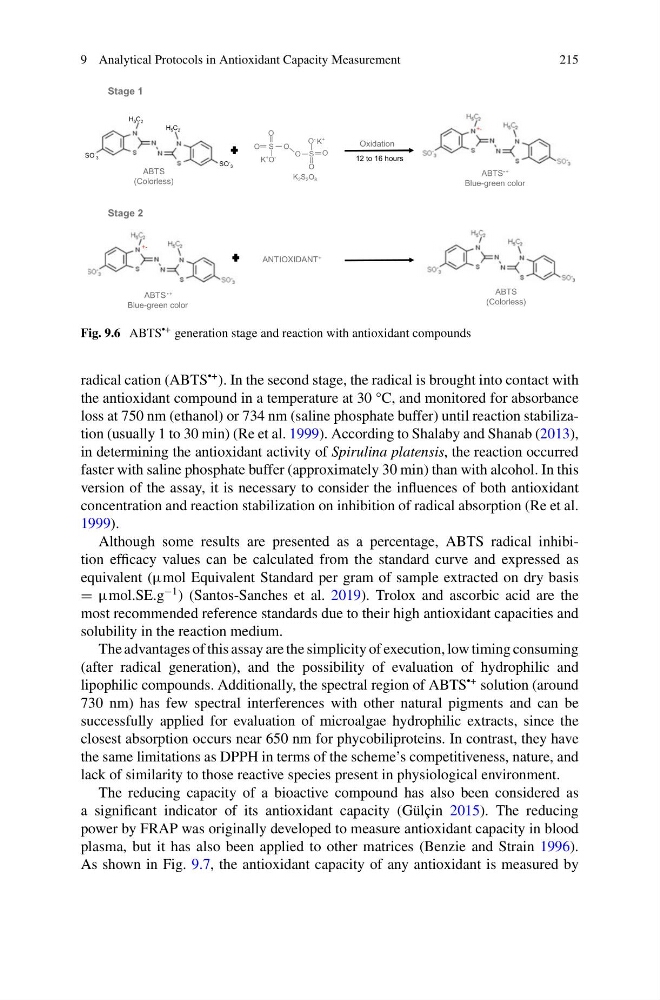
Fig. 9.6 ABTS •+ generation stage and reaction with antioxidant compounds
radical cation (ABTS
•+ ). In the second stage, the radical is brought into contact with
the antioxidant compound in a temperature at 30 °C, and monitored for absorbance
loss at 750 nm (ethanol) or 734 nm (saline phosphate buffer) until reaction stabilization (usually 1 to 30 min) (Re et al. 1999). According to Shalaby and Shanab (2013),
in determining the antioxidant activity of Spirulina platensis, the reaction occurred
faster with saline phosphate buffer (approximately 30 min) than with alcohol. In this
version of the assay, it is necessary to consider the influences of both antioxidant
concentration and reaction stabilization on inhibition of radical absorption (Re et al.
1999).
Although some results are presented as a percentage, ABTS radical inhibition efficacy values can be calculated from the standard curve and expressed as
equivalent (μmol Equivalent Standard per gram of sample extracted on dry basis
= μmol.SE.g
−1 ) (Santos-Sanches et al. 2019). Trolox and ascorbic acid are the
most recommended reference standards due to their high antioxidant capacities and
solubility in the reaction medium.
The advantages of this assay are the simplicity of execution, low timing consuming
(after radical generation), and the possibility of evaluation of hydrophilic and
lipophilic compounds. Additionally, the spectral region of ABTS
•+ solution (around
730 nm) has few spectral interferences with other natural pigments and can be
successfully applied for evaluation of microalgae hydrophilic extracts, since the
closest absorption occurs near 650 nm for phycobiliproteins. In contrast, they have
the same limitations as DPPH in terms of the scheme’s competitiveness, nature, and
lack of similarity to those reactive species present in physiological environment.
The reducing capacity of a bioactive compound has also been considered as
a significant indicator of its antioxidant capacity (Gülçin 2015). The reducing
power by FRAP was originally developed to measure antioxidant capacity in blood
plasma, but it has also been applied to other matrices (Benzie and Strain 1996).
As shown in Fig. 9.7, the antioxidant capacity of any antioxidant is measured by
215
+S
O
O
O
O
S
O -
O
O
K +
O - K +
H 5 C 2
H 5 C 2
SO -
3
SO -
3
Stage 1
Stage 2
ABTS
(Colorless)
ABTS •+
•+
Blue-green color
K 2 S 2 O 8
Oxidation
ANTIOXIDANT +
ABTS
(Colorless)
12 to 16 hours
ABTS
Blue-green color
Fig. 9.6 ABTS •+ generation stage and reaction with antioxidant compounds
radical cation (ABTS
•+ ). In the second stage, the radical is brought into contact with
the antioxidant compound in a temperature at 30 °C, and monitored for absorbance
loss at 750 nm (ethanol) or 734 nm (saline phosphate buffer) until reaction stabilization (usually 1 to 30 min) (Re et al. 1999). According to Shalaby and Shanab (2013),
in determining the antioxidant activity of Spirulina platensis, the reaction occurred
faster with saline phosphate buffer (approximately 30 min) than with alcohol. In this
version of the assay, it is necessary to consider the influences of both antioxidant
concentration and reaction stabilization on inhibition of radical absorption (Re et al.
1999).
Although some results are presented as a percentage, ABTS radical inhibition efficacy values can be calculated from the standard curve and expressed as
equivalent (μmol Equivalent Standard per gram of sample extracted on dry basis
= μmol.SE.g
−1 ) (Santos-Sanches et al. 2019). Trolox and ascorbic acid are the
most recommended reference standards due to their high antioxidant capacities and
solubility in the reaction medium.
The advantages of this assay are the simplicity of execution, low timing consuming
(after radical generation), and the possibility of evaluation of hydrophilic and
lipophilic compounds. Additionally, the spectral region of ABTS
•+ solution (around
730 nm) has few spectral interferences with other natural pigments and can be
successfully applied for evaluation of microalgae hydrophilic extracts, since the
closest absorption occurs near 650 nm for phycobiliproteins. In contrast, they have
the same limitations as DPPH in terms of the scheme’s competitiveness, nature, and
lack of similarity to those reactive species present in physiological environment.
The reducing capacity of a bioactive compound has also been considered as
a significant indicator of its antioxidant capacity (Gülçin 2015). The reducing
power by FRAP was originally developed to measure antioxidant capacity in blood
plasma, but it has also been applied to other matrices (Benzie and Strain 1996).
As shown in Fig. 9.7, the antioxidant capacity of any antioxidant is measured by