

11. At the end of the assay the machine prompts the removal of
the probe and cell plate. Discard the probe plate but retain the
cells for normalisation.
12. Calculating the number of cells used in the assay is a crucial
step as even cells seeded at the same seeding density might
vary in their settling rates as well as rate of cell division (see
Note 12).
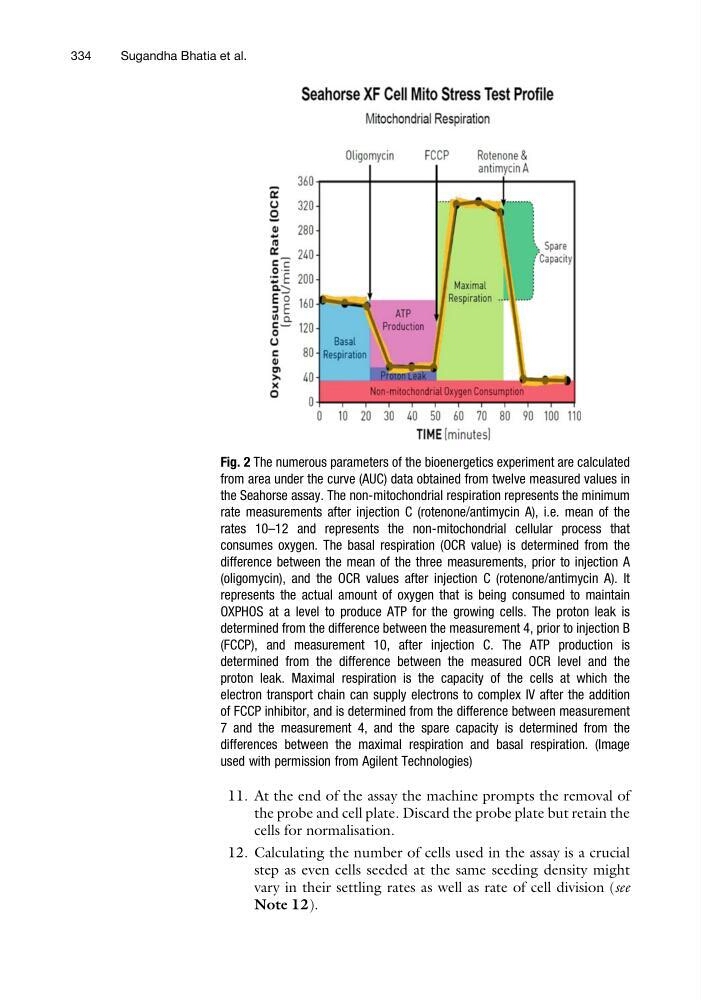
Fig. 2 The numerous parameters of the bioenergetics experiment are calculated
from area under the curve (AUC) data obtained from twelve measured values in
the Seahorse assay. The non-mitochondrial respiration represents the minimum
rate measurements after injection C (rotenone/antimycin A), i.e. mean of the
rates 10–12 and represents the non-mitochondrial cellular process that
consumes oxygen. The basal respiration (OCR value) is determined from the
difference between the mean of the three measurements, prior to injection A
(oligomycin), and the OCR values after injection C (rotenone/antimycin A). It
represents the actual amount of oxygen that is being consumed to maintain
OXPHOS at a level to produce ATP for the growing cells. The proton leak is
determined from the difference between the measurement 4, prior to injection B
(FCCP), and measurement 10, after injection C. The ATP production is
determined from the difference between the measured OCR level and the
proton leak. Maximal respiration is the capacity of the cells at which the
electron transport chain can supply electrons to complex IV after the addition
of FCCP inhibitor, and is determined from the difference between measurement
7 and the measurement 4, and the spare capacity is determined from the
differences between the maximal respiration and basal respiration. (Image
used with permission from Agilent Technologies)
334
Sugandha Bhatia et al.
the probe and cell plate. Discard the probe plate but retain the
cells for normalisation.
12. Calculating the number of cells used in the assay is a crucial
step as even cells seeded at the same seeding density might
vary in their settling rates as well as rate of cell division (see
Note 12).
Fig. 2 The numerous parameters of the bioenergetics experiment are calculated
from area under the curve (AUC) data obtained from twelve measured values in
the Seahorse assay. The non-mitochondrial respiration represents the minimum
rate measurements after injection C (rotenone/antimycin A), i.e. mean of the
rates 10–12 and represents the non-mitochondrial cellular process that
consumes oxygen. The basal respiration (OCR value) is determined from the
difference between the mean of the three measurements, prior to injection A
(oligomycin), and the OCR values after injection C (rotenone/antimycin A). It
represents the actual amount of oxygen that is being consumed to maintain
OXPHOS at a level to produce ATP for the growing cells. The proton leak is
determined from the difference between the measurement 4, prior to injection B
(FCCP), and measurement 10, after injection C. The ATP production is
determined from the difference between the measured OCR level and the
proton leak. Maximal respiration is the capacity of the cells at which the
electron transport chain can supply electrons to complex IV after the addition
of FCCP inhibitor, and is determined from the difference between measurement
7 and the measurement 4, and the spare capacity is determined from the
differences between the maximal respiration and basal respiration. (Image
used with permission from Agilent Technologies)
334
Sugandha Bhatia et al.